On this page
A $150 billion online store hiding inside a supercenter
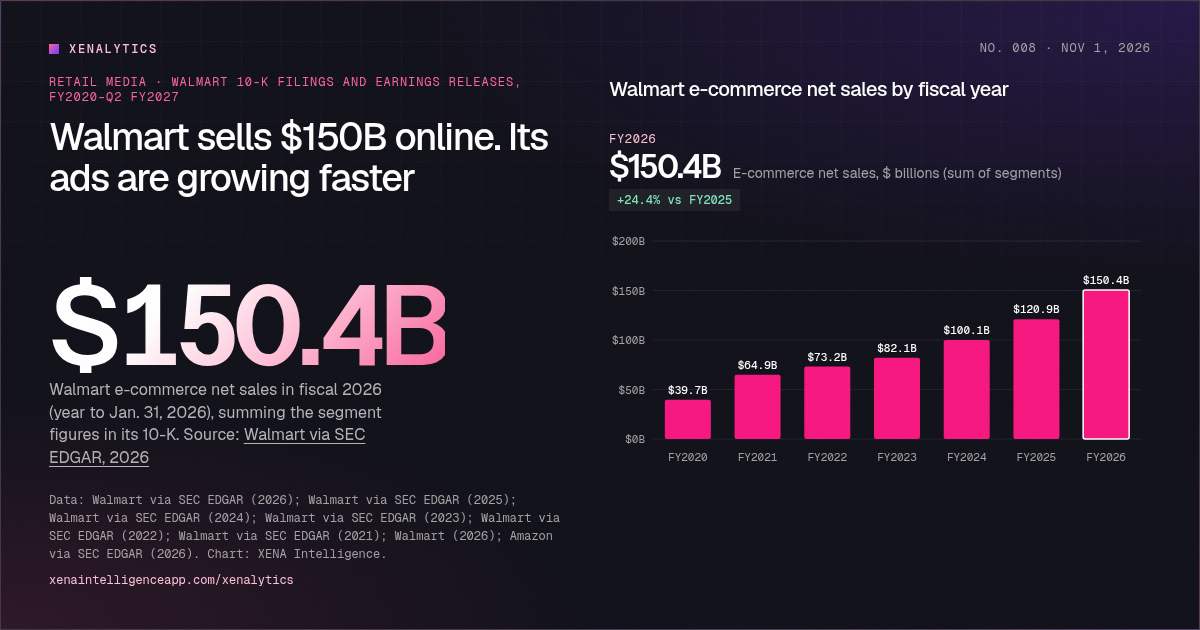
Ask most shoppers where Americans buy online and they'll say Amazon. Walmart's filings tell you to add a second name. In fiscal 2026, the year that ended January 31, 2026, Walmart reported about $150.4 billion in e-commerce net sales across its three segments. Six years earlier the same figure was about $39.7 billion.
That total is our sum of three numbers Walmart discloses in every 10-K: about $99.6 billion from Walmart U.S., $35.8 billion from Walmart International (Flipkart in India, Walmex in Mexico, plus China and Canada) and $15.0 billion from Sam's Club U.S. Use the toggles on the chart above to see each one, or switch to the online share of Walmart U.S. sales.
That last view is the one worth a pause. In fiscal 2020, e-commerce was 7.1% of Walmart U.S. net sales. In fiscal 2026 it was 20.6%. One in five dollars at the biggest U.S. retailer now starts with a tap, even if a store associate packs the order. For context, the Census Bureau put e-commerce at 17.1% of all U.S. retail sales in Q2 2026, which you can track in our U.S. e-commerce share chart. The two figures aren't measured the same way, so treat them as a rough comparison, not a ranking.
Why the curve didn't flatten after 2020
The pandemic gave Walmart's online business its biggest single jump: U.S. e-commerce grew almost 80%, from $24.1 billion to $43.0 billion, in fiscal 2021. What happened next is more interesting. Growth slowed to about 12% a year for two years, then picked back up to roughly 21% to 24% a year from fiscal 2024 on.
Walmart's own explanation is mostly about speed. Its stores double as warehouses, and the company keeps pointing to store-fulfilled delivery as the engine. In Q2 FY27 (May to July 2026), store-fulfilled delivery grew about 43%, and deliveries promised in under three hours made up about 37% of store-fulfilled orders. Walmart U.S. e-commerce has now grown 20% or more for ten straight quarters.
Where Walmart's online sales come from
E-commerce net sales by segment, $ billions. Drag the year slider or press play, and tap a slice.
Data table
| Year | Walmart U.S. | Walmart International | Sam's Club U.S. | Total |
|---|---|---|---|---|
| FY2020 | $24.1B | $11.8B | $3.8B | $39.7B |
| FY2021 | $43.0B | $16.6B | $5.3B | $64.9B |
| FY2022 | $47.8B | $18.5B | $6.9B | $73.2B |
| FY2023 | $53.4B | $20.3B | $8.4B | $82.1B |
| FY2024 | $65.4B | $24.8B | $9.9B | $100.1B |
| FY2025 | $79.3B | $29.5B | $12.1B | $120.9B |
| FY2026 | $99.6B | $35.8B | $15.0B | $150.4B |
The mix by segment barely moves, which surprised us. Walmart U.S. has been about two-thirds of the online total in every year since fiscal 2021. Drag the slider on the donut and watch the slices hold their shape while the whole ring grows. Sam's Club is small, but it grew at almost exactly the same pace as the rest.
Compare any two fiscal years
How many times bigger is Walmart's e-commerce business?
Data table
| Period | Value |
|---|---|
| FY2020 | $39.7B |
| FY2021 | $64.9B |
| FY2022 | $73.2B |
| FY2023 | $82.1B |
| FY2024 | $100.1B |
| FY2025 | $120.9B |
| FY2026 | $150.4B |
The faster business riding on top
Here is the part that matters most for brands. Every online visit to Walmart is also an ad impression, and Walmart has gotten much better at selling them.
Guess: how big was Walmart's global advertising business in fiscal 2026?
Answer: $6.4B. Nearly $6.4 billion, up 46% including VIZIO, per Walmart's fiscal 2026 fourth-quarter release. For scale, Amazon reported $68.6 billion in advertising sales for calendar 2025, about 11 times as much.
Sources: Walmart via SEC EDGAR, 2026; Amazon via SEC EDGAR, 2026
Walmart reports a "global advertising business" once a year in its fourth-quarter release. It was $2.7 billion in fiscal 2023, $3.4 billion in fiscal 2024, $4.4 billion in fiscal 2025 and nearly $6.4 billion in fiscal 2026. That last jump, 46%, includes VIZIO, the smart-TV maker Walmart bought in December 2024 for net cash of $1.9 billion. So don't read the whole leap as organic.
Walmart global advertising business by fiscal year
As stated in Walmart's fourth-quarter earnings releases. Tap a bar for the exact figure and growth rate.
Data table
| Period | Advertising |
|---|---|
| FY2023 | $2.7B |
| FY2024 | $3.4B |
| FY2025 | $4.4B |
| FY2026 | $6.4B |
The cleaner signal is Walmart Connect, Walmart's U.S. retail media business, which Walmart reports excluding VIZIO. Switch the quarterly chart below to "Advertising." Walmart Connect grew in the 20s through most of fiscal 2025, moved into the low 30s in fiscal 2026, then hit 41% in Q4 FY26, 44% in Q1 FY27 and 43% in Q2 FY27. Now switch to "E-commerce." Walmart U.S. online sales grew 24% to 27% in those last three quarters. The ad business is growing faster than the traffic it sells against.
Quarterly growth: e-commerce vs. advertising
Year-over-year growth as reported each quarter. Switch between e-commerce and advertising, and tap the legend to hide a line.
Data table
| Period | Advertising: Walmart Connect (U.S.) | Advertising: Global advertising business | E-commerce: Walmart U.S. e-commerce | E-commerce: Global e-commerce |
|---|---|---|---|---|
| Q4 FY24 | 22% | 33% | 17% | 23% |
| Q1 FY25 | 26% | 24% | 22% | 21% |
| Q2 FY25 | 30% | 26% | 22% | 21% |
| Q3 FY25 | 26% | 28% | 22% | 27% |
| Q4 FY25 | 24% | 29% | 20% | 16% |
| Q1 FY26 | 31% | 50% | 21% | 22% |
| Q2 FY26 | 31% | 46% | 26% | 25% |
| Q3 FY26 | 33% | 53% | 28% | 27% |
| Q4 FY26 | 41% | 37% | 27% | 24% |
| Q1 FY27 | 44% | 37% | 26% | 26% |
| Q2 FY27 | 43% | 38% | 24% | 23% |
Walmart CFO John David Rainey said as much on the August 20 call: for the model to work, ad growth has to outpace e-commerce growth, "and that's actually what we've been seeing." In the same quarter Walmart closed its purchase of Vibe, a self-serve ad platform, to reach smaller advertisers.
Keep the scale in mind, though. Amazon reported $68.6 billion in ad sales for calendar 2025, roughly 11 times Walmart's figure. We broke that down in Amazon's revenue mix. Walmart is the challenger here, but it's the challenger growing at more than 40% a year.
Marketplace sellers are the other half of the story
Advertisers on Walmart aren't only big CPG brands buying sponsored listings. In Q4 FY25, Walmart said Walmart Connect growth was helped by a 50% increase in the number of marketplace sellers advertising. And the marketplace itself keeps speeding up.
In Q2 FY27 (May to July 2026), which of these Walmart numbers grew fastest?
Answer: U.S. marketplace sales. U.S. marketplace sales, up 52%. Walmart Connect grew 43% excluding VIZIO, Walmart U.S. e-commerce grew 24% and global membership fee revenue grew 17%. Walmart also said nearly 50% of its marketplace business now flows through its own fulfillment program for sellers (WFS), up nearly 4 points from a year earlier.
Sources: Walmart via SEC EDGAR, 2026; Walmart via SEC EDGAR, 2026; Walmart, 2026
U.S. marketplace sales grew 52% in Q2 FY27. Nearly half of that marketplace business now flows through WFS, Walmart's fulfillment program for sellers. More third-party sellers means more competition for the same search results, more bidders for the same ad slots, and more listings fighting for the Buy Box on a shared product page.
What it means for brands
If you sell consumer products in the U.S., a few practical points follow from these numbers.
Walmart is no longer a side channel. About $99.6 billion of U.S. online sales is a bigger pool than many brands' planning assumes. If your Walmart content, pricing and stock get less attention than Amazon's, you're leaving a growing share of shelf space to whoever pays attention.
Plan for ad costs to rise with the auction. When ad sales grow 40% while e-commerce grows 25%, more money is chasing each shopper. Watch total ad cost against total sales (TACoS) rather than campaign-level numbers alone, and check whether organic rank is holding up as you spend.
Fix the product data first. Walmart's search, its ads and its new AI shopping agents all read the same catalog fields. On October 21, 2026, Walmart opened a gateway for outside AI agents to shop on a customer's behalf, which we covered in Walmart's agent gateway post. Agents compare attributes, pack sizes and prices directly. Missing fields make a product hard to pick, however much you spend on ads. That is what agentic commerce looks like in practice.
Measure across retailers, not one at a time. Walmart and Amazon report on different calendars and define e-commerce differently, and your own dashboards probably do too. A single view of sales, ad spend and share across marketplaces makes these trends visible early. We explain why in unified marketplace data.
Methodology
Annual e-commerce figures come from the revenue note in Walmart's 10-K filings for fiscal 2021 through fiscal 2026, which give an approximate e-commerce amount for each segment. Our all-Walmart total adds the three segments. The online share divides Walmart U.S. e-commerce by Walmart U.S. net sales from the same table. Quarterly growth rates and annual ad totals are quoted from Walmart's earnings releases, and the Q2 FY27 marketplace and fulfillment figures come from that quarter's presentation and call. Walmart counts store-fulfilled online orders and certain ad arrangements as e-commerce, so its figures are not directly comparable to Amazon's or the Census Bureau's. Full notes and every source are below.
Methodology and notes
- Walmart's fiscal year ends January 31. FY2026 means February 1, 2025 to January 31, 2026. Quarter labels follow Walmart's own (Q2 FY27 is May to July 2026).
- Annual e-commerce figures are the approximate amounts Walmart discloses for each segment in the disaggregated revenue note of its 10-K. Where a later 10-K repeats an earlier year, the figures match. The all-Walmart total is our sum of the three segments; Walmart's fiscal 2024 release separately said it crossed $100 billion in e-commerce sales.
- Walmart defines e-commerce broadly: orders started online and picked up or delivered from a store or club count, as do certain advertising arrangements. It is not directly comparable with Census Bureau e-commerce estimates or with Amazon's online-store line.
- The online share of Walmart U.S. sales is our calculation: Walmart U.S. e-commerce net sales divided by Walmart U.S. total net sales from the same 10-K table.
- Advertising figures are as stated in fourth-quarter releases. Walmart books advertising either in net sales or as a reduction to cost of sales, so it isn't reported as one revenue line. From fiscal 2026 the global figure includes VIZIO; Walmart Connect growth rates from Q1 FY26 exclude it.
- Amazon's $68.6 billion is for the calendar year 2025; Walmart's fiscal 2026 ends one month later. The comparison is for scale only.
- The Census Bureau comparison (17.1% of U.S. retail sales online in Q2 2026, seasonally adjusted) uses a different definition from Walmart's and is shown for context only. Quotes from Walmart's CFO are from the Q2 FY27 earnings call transcript.
- Charts, rankings and calculated figures (growth rates, multiples, gaps) are XENA Intelligence calculations from the sources below. Estimates and forecasts are labelled as such.
Glossary terms in this article
Sources
- Walmart via SEC EDGAR (2026). Walmart Inc. Form 10-K for the fiscal year ended January 31, 2026
- Walmart via SEC EDGAR (2025). Walmart Inc. Form 10-K for the fiscal year ended January 31, 2025
- Walmart via SEC EDGAR (2024). Walmart Inc. Form 10-K for the fiscal year ended January 31, 2024
- Walmart via SEC EDGAR (2023). Walmart Inc. Form 10-K for the fiscal year ended January 31, 2023
- Walmart via SEC EDGAR (2022). Walmart Inc. Form 10-K for the fiscal year ended January 31, 2022
- Walmart via SEC EDGAR (2021). Walmart Inc. Form 10-K for the fiscal year ended January 31, 2021
- Walmart via SEC EDGAR (2026). Walmart Q2 FY27 earnings release (August 20, 2026)
- Walmart via SEC EDGAR (2026). Walmart Q2 FY27 earnings presentation (August 20, 2026)
- Walmart (2026). Walmart Q2 FY27 earnings call transcript (August 20, 2026)
- Walmart via SEC EDGAR (2026). Walmart Q1 FY27 earnings release (May 21, 2026)
- Walmart via SEC EDGAR (2026). Walmart Q4 and fiscal 2026 earnings release (February 19, 2026)
- Walmart via SEC EDGAR (2025). Walmart Q3 FY26 earnings release (November 20, 2025)
- Walmart via SEC EDGAR (2025). Walmart Q2 FY26 earnings release (August 21, 2025)
- Walmart via SEC EDGAR (2025). Walmart Q1 FY26 earnings release (May 15, 2025)
- Walmart via SEC EDGAR (2025). Walmart Q4 and fiscal 2025 earnings release (February 20, 2025), including 50% growth in marketplace seller advertiser counts
- Walmart via SEC EDGAR (2024). Walmart Q3 FY25 earnings release (November 19, 2024)
- Walmart via SEC EDGAR (2024). Walmart Q2 FY25 earnings release (August 15, 2024)
- Walmart via SEC EDGAR (2024). Walmart Q1 FY25 earnings release (May 16, 2024)
- Walmart via SEC EDGAR (2024). Walmart Q4 and fiscal 2024 earnings release (February 20, 2024)
- Walmart via SEC EDGAR (2023). Walmart Q4 and fiscal 2023 earnings release (February 21, 2023)
- Amazon via SEC EDGAR (2026). Amazon.com, Inc. Form 10-K for 2025: disaggregation of net sales by group
- US Census Bureau via FRED, Federal Reserve Bank of St. Louis (2026). E-Commerce Retail Sales as a Percent of Total Sales (ECOMPCTSA)
Cite this infographic
Free to cite and share with a link back to this page.