On this page
Before you look: what share of US retail sales happened online in Q2 2026?
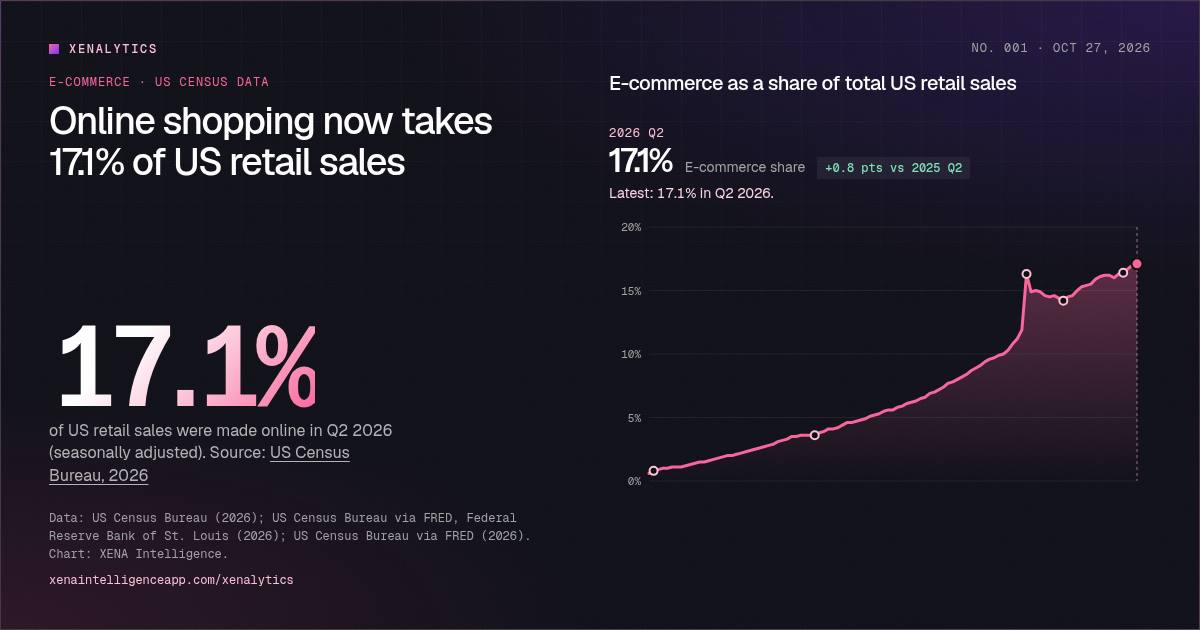
Answer: 17.1%. The answer is 17.1% (US Census Bureau, seasonally adjusted). Online keeps setting records, but more than 4 of every 5 US retail dollars are still spent offline, and the total includes cars and gasoline.
Source: US Census Bureau via FRED, Federal Reserve Bank of St. Louis, 2026
The long climb, in one line
In the fourth quarter of 1999, when the US Census Bureau started tracking online retail every quarter, e-commerce came to 0.6% of US retail sales. That is about half a cent of every dollar. In the second quarter of 2026 it was 17.1%, the highest share on record.
For most of that time, the line on the chart above barely wiggles. Online's share rose about a percentage point every two years through the 2000s and early 2010s. The 2008 financial crisis paused the climb but didn't reverse it: share held at 3.6% for four straight quarters, then started rising again. Scrub the chart to 2010 and you will see 4.6%; by the end of 2015 it was 7.4%.
That steadiness matters. E-commerce growth was never mainly a fad or a stimulus effect. It was a slow change in habits, one category at a time: books and electronics first, then apparel, then household goods, and finally groceries and other everyday purchases.
The pandemic spike, and the hangover
Then came the second quarter of 2020. With stores closed and people at home, online's share jumped from 11.9% to 16.3% in one quarter. That is more than four percentage points in three months. Before then, gaining that much had taken about four years.
What happened next is just as revealing. As stores reopened, online's share fell back to 14.2% by mid-2022. Shoppers didn't abandon e-commerce: seasonally adjusted online sales kept growing in dollar terms. Switch the chart to $ sales to see it. But in-store spending came back even faster, likely helped by higher prices in categories still bought mostly in person, such as cars, fuel and groceries.
It took until the third quarter of 2025 for online's share (16.4%) to beat the pandemic peak, 21 quarters later. Since then it has kept rising: 16.7% in Q4 2025, 17.0% in Q1 2026 and 17.1% in Q2 2026.
Online cents in every US retail dollar
Fourth quarter of each year, seasonally adjusted share of total retail sales. Tap a bar.
Data table
| Period | Share |
|---|---|
| 2000 | 1.0% |
| 2005 | 2.6% |
| 2010 | 4.6% |
| 2015 | 7.4% |
| 2020 | 15.0% |
| 2025 | 16.7% |
What 17.1% does and doesn't mean
This number is often misread, so here are three points to keep in mind.
It is a share of all retail, including cars and gas. The Census Bureau divides e-commerce sales by total retail sales, which includes motor vehicle dealers and gas stations. Those are huge categories that are still mostly sold offline. Measures that leave them out show a higher online share, which is one reason you will see larger figures quoted elsewhere. Neither figure is wrong; they answer different questions.
It counts where the order was placed, not where it was picked up. Census treats a sale as e-commerce when the order or the price and terms are agreed online. A buy-online, pick-up-in-store order counts as online. A product researched on a phone and then bought at the register does not, even though digital clearly shaped the purchase.
It is seasonally adjusted and revised. Holiday quarters naturally spike online, so the chart uses the seasonally adjusted series to show the trend. The Census Bureau also revises earlier quarters as better data comes in. We use the values published on FRED as of October 2026, and we will update this page when they change.
The dollars behind the share
Seasonally adjusted e-commerce sales reached $340.2 billion in Q2 2026, up from $303.3 billion a year earlier, a gain of about 12.2%. Online keeps growing faster than retail as a whole, so its share keeps rising, slowly. Every quarter, a little more of the "shelf" moves to the screen.
Compare any two quarters
Pick two quarters to see how far online's share moved.
Data table
| Period | Value |
|---|---|
| 1999 Q4 | 0.6% |
| 2000 Q1 | 0.8% |
| 2000 Q2 | 0.9% |
| 2000 Q3 | 1.0% |
| 2000 Q4 | 1.0% |
| 2001 Q1 | 1.1% |
| 2001 Q2 | 1.1% |
| 2001 Q3 | 1.1% |
| 2001 Q4 | 1.2% |
| 2002 Q1 | 1.3% |
| 2002 Q2 | 1.4% |
| 2002 Q3 | 1.5% |
| 2002 Q4 | 1.5% |
| 2003 Q1 | 1.6% |
| 2003 Q2 | 1.7% |
| 2003 Q3 | 1.8% |
| 2003 Q4 | 1.9% |
| 2004 Q1 | 2.0% |
| 2004 Q2 | 2.0% |
| 2004 Q3 | 2.1% |
| 2004 Q4 | 2.2% |
| 2005 Q1 | 2.3% |
| 2005 Q2 | 2.4% |
| 2005 Q3 | 2.5% |
| 2005 Q4 | 2.6% |
| 2006 Q1 | 2.7% |
| 2006 Q2 | 2.8% |
| 2006 Q3 | 2.9% |
| 2006 Q4 | 3.1% |
| 2007 Q1 | 3.2% |
| 2007 Q2 | 3.3% |
| 2007 Q3 | 3.5% |
| 2007 Q4 | 3.5% |
| 2008 Q1 | 3.6% |
| 2008 Q2 | 3.6% |
| 2008 Q3 | 3.6% |
| 2008 Q4 | 3.6% |
| 2009 Q1 | 3.8% |
| 2009 Q2 | 3.9% |
| 2009 Q3 | 4.1% |
| 2009 Q4 | 4.1% |
| 2010 Q1 | 4.2% |
| 2010 Q2 | 4.4% |
| 2010 Q3 | 4.6% |
| 2010 Q4 | 4.6% |
| 2011 Q1 | 4.7% |
| 2011 Q2 | 4.8% |
| 2011 Q3 | 4.9% |
| 2011 Q4 | 5.1% |
| 2012 Q1 | 5.2% |
| 2012 Q2 | 5.3% |
| 2012 Q3 | 5.5% |
| 2012 Q4 | 5.6% |
| 2013 Q1 | 5.6% |
| 2013 Q2 | 5.8% |
| 2013 Q3 | 5.9% |
| 2013 Q4 | 6.1% |
| 2014 Q1 | 6.2% |
| 2014 Q2 | 6.3% |
| 2014 Q3 | 6.5% |
| 2014 Q4 | 6.6% |
| 2015 Q1 | 6.9% |
| 2015 Q2 | 7.0% |
| 2015 Q3 | 7.2% |
| 2015 Q4 | 7.4% |
| 2016 Q1 | 7.7% |
| 2016 Q2 | 7.8% |
| 2016 Q3 | 8.0% |
| 2016 Q4 | 8.2% |
| 2017 Q1 | 8.4% |
| 2017 Q2 | 8.7% |
| 2017 Q3 | 8.9% |
| 2017 Q4 | 9.1% |
| 2018 Q1 | 9.4% |
| 2018 Q2 | 9.6% |
| 2018 Q3 | 9.7% |
| 2018 Q4 | 9.9% |
| 2019 Q1 | 10.0% |
| 2019 Q2 | 10.3% |
| 2019 Q3 | 10.8% |
| 2019 Q4 | 11.2% |
| 2020 Q1 | 11.9% |
| 2020 Q2 | 16.3% |
| 2020 Q3 | 14.9% |
| 2020 Q4 | 15.0% |
| 2021 Q1 | 14.9% |
| 2021 Q2 | 14.6% |
| 2021 Q3 | 14.5% |
| 2021 Q4 | 14.6% |
| 2022 Q1 | 14.4% |
| 2022 Q2 | 14.2% |
| 2022 Q3 | 14.5% |
| 2022 Q4 | 14.6% |
| 2023 Q1 | 15.0% |
| 2023 Q2 | 15.3% |
| 2023 Q3 | 15.4% |
| 2023 Q4 | 15.5% |
| 2024 Q1 | 15.9% |
| 2024 Q2 | 16.1% |
| 2024 Q3 | 16.2% |
| 2024 Q4 | 16.2% |
| 2025 Q1 | 16.0% |
| 2025 Q2 | 16.3% |
| 2025 Q3 | 16.4% |
| 2025 Q4 | 16.7% |
| 2026 Q1 | 17.0% |
| 2026 Q2 | 17.1% |
Use the comparison tool to measure any stretch you like. Q4 2019 to Q2 2026 is a good one: from 11.2% to 17.1%, a 5.9-point gain. That is roughly what the pandemic added in one burst, but this time it came as steady, lasting growth.
Why this matters for brands
For e-commerce and consumer brands, the share line is a guide to where competition for attention is moving. Three practical takeaways:
- The digital shelf is the shelf. At 17.1% of all retail, and a much bigger share of many non-auto, non-fuel categories, your product detail pages, marketplace listings and retail media are now a primary storefront, not a side channel.
- Discovery is changing faster than purchasing. The share chart measures where the transaction happens. More and more of the research behind both online and in-store purchases now starts in search engines, marketplaces and AI assistants. If your brand isn't visible there, the purchase can be lost before the shopper ever reaches a checkout.
- Steady beats spiky. The pandemic spike faded, and the slow trend won. Brands that planned for 2020's numbers to last over-invested; brands that ignored the long trend are still catching up. Plan for steady, compounding growth.
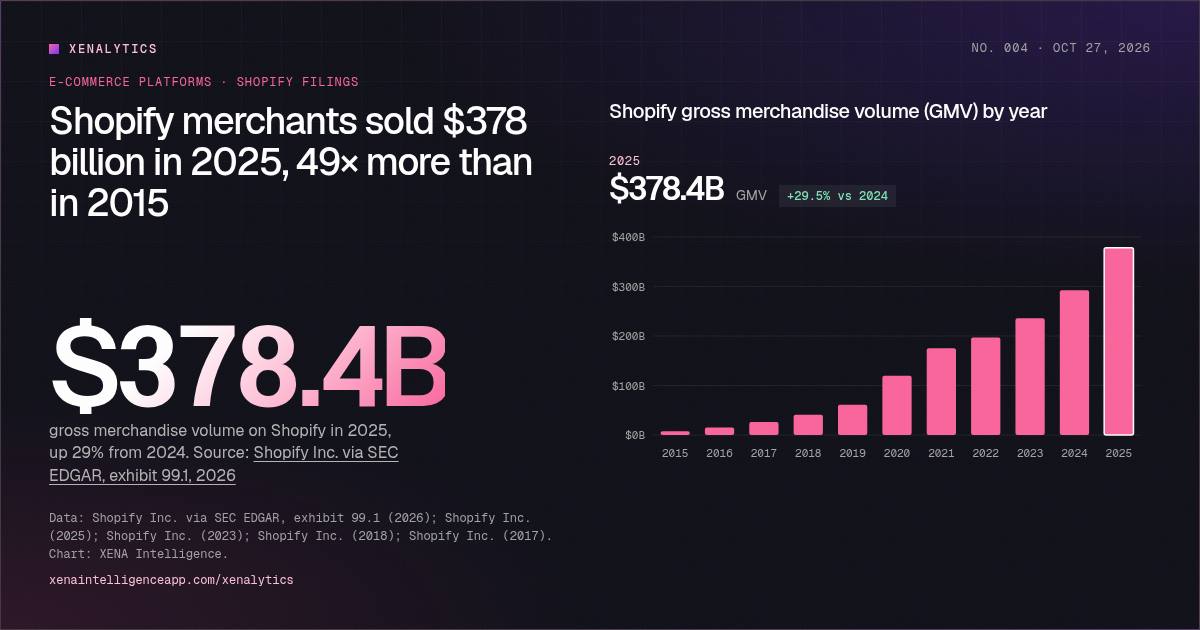
There is one more thing to watch. Shopify estimates that its merchants alone made more than 14% of US e-commerce sales in 2025. That is the company's own estimate, built partly from Census data, but it shows how much of online retail now runs through platforms and marketplaces rather than through brands' own technology.
Methodology
All figures come from the US Census Bureau's Quarterly Retail E-Commerce Sales program, retrieved through the Federal Reserve Bank of St. Louis (FRED series ECOMPCTSA and ECOMSA). Percentages are seasonally adjusted e-commerce sales as a share of seasonally adjusted total retail sales. Dollar values are seasonally adjusted quarterly sales in billions. Growth rates and multiples marked as XENA calculations are computed directly from those series. The full quarterly table is below the chart and in this page's downloadable dataset.
Methodology and notes
- All shares are seasonally adjusted e-commerce sales divided by seasonally adjusted total retail sales, as published by the Census Bureau. The Census Bureau revises earlier quarters; we used the values published on FRED as of October 2026, which list the Q2 2020 peak at 16.3%.
- Total retail includes motor vehicle dealers and gas stations, which sell mostly offline. Measures that exclude them would show a higher online share, so other trackers may quote larger numbers.
- Dollar figures are seasonally adjusted quarterly sales, not annual totals. The 12.2% year-over-year growth for Q2 2026 is a XENA calculation from the seasonally adjusted series.
- Charts, rankings and calculated figures (growth rates, multiples, gaps) are XENA Intelligence calculations from the sources below. Estimates and forecasts are labelled as such.
Sources
- US Census Bureau (2026). Quarterly Retail E-Commerce Sales, 2nd Quarter 2026
- US Census Bureau via FRED, Federal Reserve Bank of St. Louis (2026). E-Commerce Retail Sales as a Percent of Total Sales (ECOMPCTSA)
- US Census Bureau via FRED (2026). E-Commerce Retail Sales (ECOMSA), millions of dollars, seasonally adjusted
- Shopify Inc., SEC exhibit 99.1 (2026). Shopify Q4 and full-year 2025 results (US e-commerce market share estimate)
Cite this infographic
Free to cite and share with a link back to this page.
Embed this infographic
Paste this code into your site or newsletter. The embed is interactive and links back to the full analysis.