On this page
Two ways to grow, and this quarter you could see both
Every big packaged-goods company reports a headline growth number, and every one of them breaks it into two parts: selling more stuff, and charging more for it. For most of 2022 and 2023, price did nearly all the work. The question investors kept asking this October was whether shoppers were back to buying more.
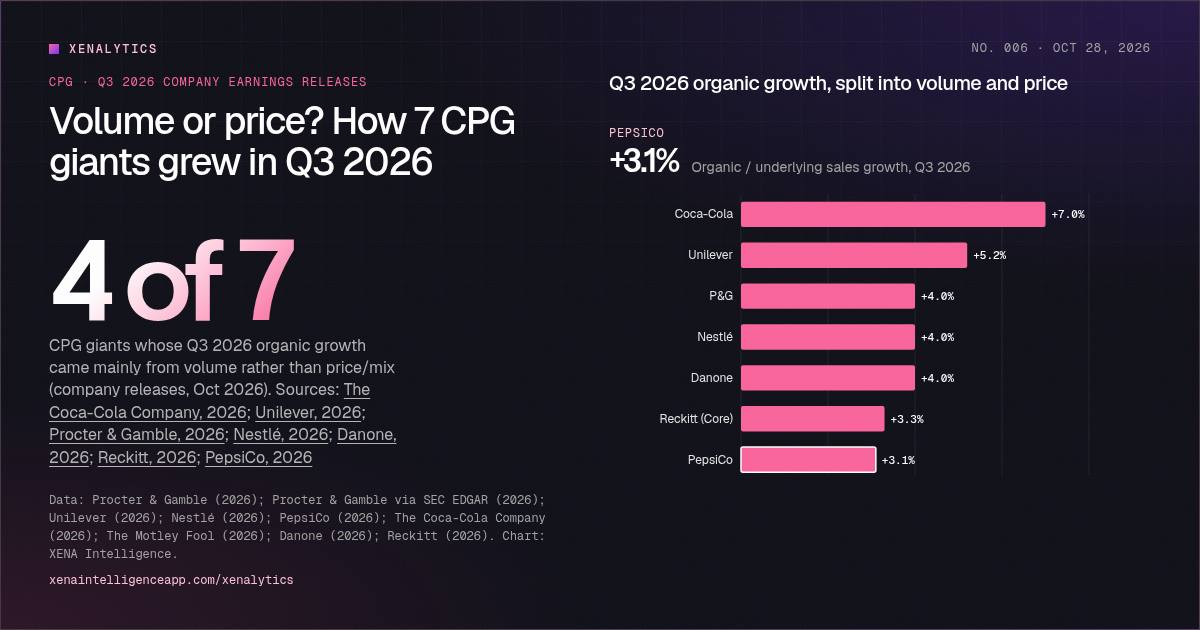
The answer from the seven companies in the chart above is: it depends who you ask. Coca-Cola, Unilever, P&G and Nestlé got most of their Q3 2026 growth from volume. Danone, Reckitt and PepsiCo got most of theirs from price. Use the toggle to flip between Organic growth, Volume and Price / mix and watch the order change.
A quick word on the numbers before reading too much into them. Each company uses its own definition (organic sales, underlying sales growth, like-for-like), and they don't all measure volume the same way. Nestlé's "real internal growth" includes mix, for example, while P&G splits volume, pricing and mix into three columns. The notes at the bottom spell out every difference. The direction is clear even so.
The volume-led four
Coca-Cola posted the biggest number: organic revenue up 7%, with concentrate sales up 7% and price/mix up just 1%. There is a catch. Concentrate shipments ran two points ahead of unit case volume, which grew 5%, so part of the volume was timing. The price/mix line is more interesting than it looks: Coca-Cola said on its earnings call that it took about four points of pricing, and three of them were eaten by unfavorable mix, mostly geographic. On the earnings call, the company said unit case growth was led by India, China, Mexico and Brazil. North America unit cases were flat.
Unilever grew underlying sales 5.2%, with 2.9 points from volume and 2.3 from price. Price picked up on purpose this quarter, as the company passed through higher commodity costs in Home Care and Personal Care. Its Power Brands grew 5.8% with 3.3% volume, and the home and personal care side grew 7.0% with 4.1% volume. Foods was flat. Unilever now expects at least 3% volume growth for the full year.
P&G grew organic sales 4% in its July–September quarter: 2.4 points of volume, 1.1 of mix and 0.4 of pricing. All 10 product categories and all six regions grew, and 29 of its top 50 category-country combinations held or gained share.
Nestlé grew 4.0% organically, with real internal growth of 2.8% and pricing of 1.1%. That RIG figure is the one Nestlé has been working toward, and it was positive in every zone. Emerging markets grew 6.8% with 4.3% RIG.
The price-led three
Danone is the clearest price story. Like-for-like sales rose 4.0%, but price contributed 3.6 points and volume/mix only 0.4. In North America it was starker still: +3.0% price, −0.6% volume/mix.
Core Reckitt grew 3.3%, of which 3.2 points were price/mix and 0.1 was volume. The averages hide a lot here. Emerging markets grew 8.0% with 2.3% volume, while North America fell 1.3% because manufacturing constraints held back Lysol supply even as demand stayed strong.
PepsiCo grew organic revenue 3.1%, up from 2.7% for the year to date, and the components in its reconciliation table show about 0.5 points of volume and 3 points of effective net pricing. In North American snacks the pattern ran the other way: savory volumes and volume share improved, but effective net pricing was lower, which PepsiCo ties to its affordability initiatives.
How much of the growth was volume?
Switch the metric to re-sort the seven companies.
Data table
| Item | Volume share of growth | Organic growth | Volume | Price / mix |
|---|---|---|---|---|
| Coca-Cola | 100% | +7.0% | +7.0% | +1.0% |
| Unilever | 56% | +5.2% | +2.9% | +2.3% |
| P&G | 60% | +4.0% | +2.4% | +1.5% |
| Nestlé | 70% | +4.0% | +2.8% | +1.1% |
| Danone | 10% | +4.0% | +0.4% | +3.6% |
| Reckitt (Core) | 3% | +3.3% | +0.1% | +3.2% |
| PepsiCo | 16% | +3.1% | +0.5% | +3.0% |
Sort the ranking by Volume share of growth to see the split most plainly. It is our own calculation, volume divided by total organic growth, and it runs from nearly all volume at Coca-Cola to almost none at Reckitt.
Which of these companies got the most growth from price in Q3 2026?
Answer: Danone. Danone. Its like-for-like sales rose 4.0%, with price contributing +3.6% and volume/mix just +0.4%, per its Q3 2026 release. Unilever's price growth was 2.3%, P&G's pricing was 0.4% (plus 1.1% mix) and Nestlé's was 1.1%.
Sources: Danone, 2026; Unilever, 2026; Procter & Gamble, 2026; Nestlé, 2026
Inside one portfolio: P&G by category
A company-wide number can hide very different businesses underneath. P&G is a good example, because it publishes the split for every segment.
Inside P&G: which categories sold more units?
July–September 2026. Toggle between organic sales growth and organic volume by segment.
Data table
| Period | Organic sales | Organic volume |
|---|---|---|
| Fabric & Home Care | +4.8% | +4.3% |
| Beauty | +5.4% | +2.2% |
| Grooming | +4.5% | −0.4% |
| Baby, Feminine & Family | +3.0% | +2.3% |
| Health Care | +2.7% | −2.9% |
Fabric & Home Care (Tide, Ariel, Dawn) grew organic sales 4.8% on 4.3% more volume. That's real demand. Grooming grew 4.5% while selling 0.4% fewer units, and Health Care grew 2.7% on 2.9% fewer units. Those two segments are growing on pricing and mix, not on more shoppers putting more items in the cart.
The same split shows up elsewhere this season. L'Oréal, which doesn't publish a volume-price split and so isn't in the charts, grew like-for-like sales 7.2% in Q3 and says its growth was driven mainly by mix and volume. It also reports e-commerce growth of around 17% for the first nine months, far ahead of its overall rate.
Guess: how much did P&G sell in its July–September 2026 quarter?
Answer: $23.3B. $23.3 billion in net sales, up 4% from $22.4 billion a year earlier, per P&G's fiscal Q1 2027 release. That is about $253 million a day.
Source: Procter & Gamble, 2026
What it means for brands
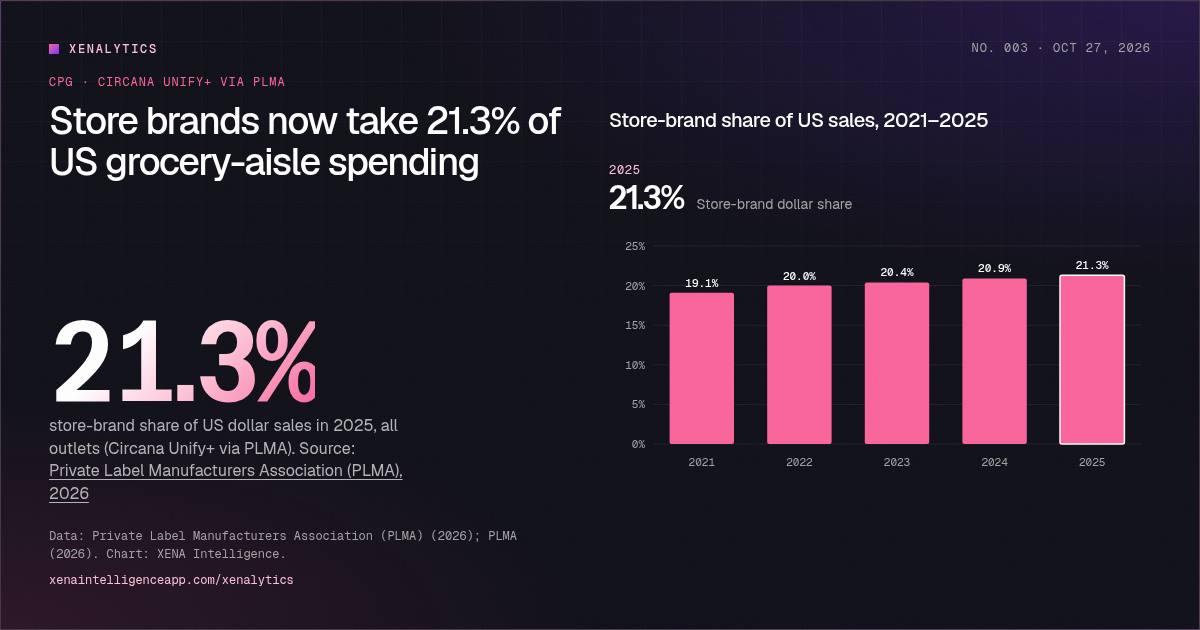
When a category grows on volume, the fight is for the extra units: who gets found, who gets picked, whose listing converts. When it grows on price, the fight is over whether shoppers keep paying more, and the cheaper option sitting next to you on the shelf or the search results page becomes the threat. Our store-brand share analysis shows how much of each category has already gone to retailers' own labels.
Either way, more of that fight now happens online. A few practical points for brand teams reading these results:
- Know which kind of growth your category is getting. If your segment looks like P&G Health Care (prices up, units down), protect the price gap with better content, reviews and claims on every product page. Our AI-ready product listing checklist is a good place to start.
- Fight for units where they're being won. Nestlé, Unilever, Coca-Cola and Reckitt all pointed to emerging markets for their volume, and L'Oréal's e-commerce is growing far faster than the group. Marketplaces such as Amazon, Noon and Talabat reward availability, the Buy Box and steady retail media spend more than one-off promotions.
- Measure share, not just sales. P&G reports share across its top 50 category-country combinations for a reason. Online, the equivalent is share of search and share of voice in AI answers, and you need them in one place. See why unified marketplace data matters.
This is the work XENA's team does with brands through XENA 360: running the marketplace day to day so that a brand's share of the online shelf keeps pace with what the company tells investors.
Methodology
We took each figure from the company's own Q3 2026 earnings release or trading statement, published between October 8 and October 28, 2026, and linked below. Totals and components are shown as reported and rounded, so they may not add exactly. "Volume share of growth" and the "mainly volume" count are our own calculations from those rounded figures. Colgate-Palmolive and Kimberly-Clark had not yet published full Q3 2026 results with a volume and price split when this was written, so they are not included. We'll update the piece as they report.
Methodology and notes
- All figures are taken from each company's own Q3 2026 release. Organic growth goes by different names: organic sales (P&G), underlying sales growth (Unilever), organic growth (Nestlé), organic revenue (PepsiCo, Coca-Cola) and like-for-like (Danone, Reckitt). All exclude currency and acquisitions/disposals, but the definitions are not identical.
- Volume is not measured the same way everywhere. Nestlé's RIG and Danone's volume/mix include mix; P&G reports volume, pricing and mix separately, so P&G's price/mix here is pricing plus mix. Coca-Cola's figure is concentrate sales, which ran 2 points ahead of unit case volume because of shipment timing.
- Quarters differ slightly: P&G's quarter is July–September 2026 (its fiscal Q1 2027), PepsiCo's is the 12 weeks to September 5, 2026, and Coca-Cola's ended October 2, 2026.
- 'Volume share of growth' and 'mainly volume' are XENA calculations from the rounded published figures, not company metrics.
- L'Oréal (+7.2% like-for-like in Q3) is discussed in the article but left out of the charts because it does not publish a volume/price split.
- Charts, rankings and calculated figures (growth rates, multiples, gaps) are XENA Intelligence calculations from the sources below. Estimates and forecasts are labelled as such.
Glossary terms in this article
Sources
- Procter & Gamble (2026). P&G Announces Fiscal Year 2027 First Quarter Results (Exhibit 99.1)
- Procter & Gamble via SEC EDGAR (2026). P&G Q1 FY 2027 Results, earnings release slides (October 22, 2026)
- Unilever (2026). Q3 2026 Trading Statement: Continued strong performance in the third quarter
- Nestlé (2026). Third-quarter and nine-month 2026 sales
- PepsiCo (2026). PepsiCo Reports Third-Quarter 2026 Results (Q3 2026 8-K Exhibit 99.1)
- The Coca-Cola Company (2026). Coca-Cola Reports Third Quarter 2026 Results and Raises Full Year Guidance
- The Motley Fool (2026). Coca-Cola (KO) Q3 2026 Earnings Call Transcript
- Danone (2026). Solid performance in Q3: broad-based growth across categories and geographies
- Reckitt (2026). Q3 Results 2026: Powerbrands driving continued growth
- L'Oréal (2026). Sales at 30 September 2026
Cite this infographic
Free to cite and share with a link back to this page.