On this page
A retailer with a media company inside
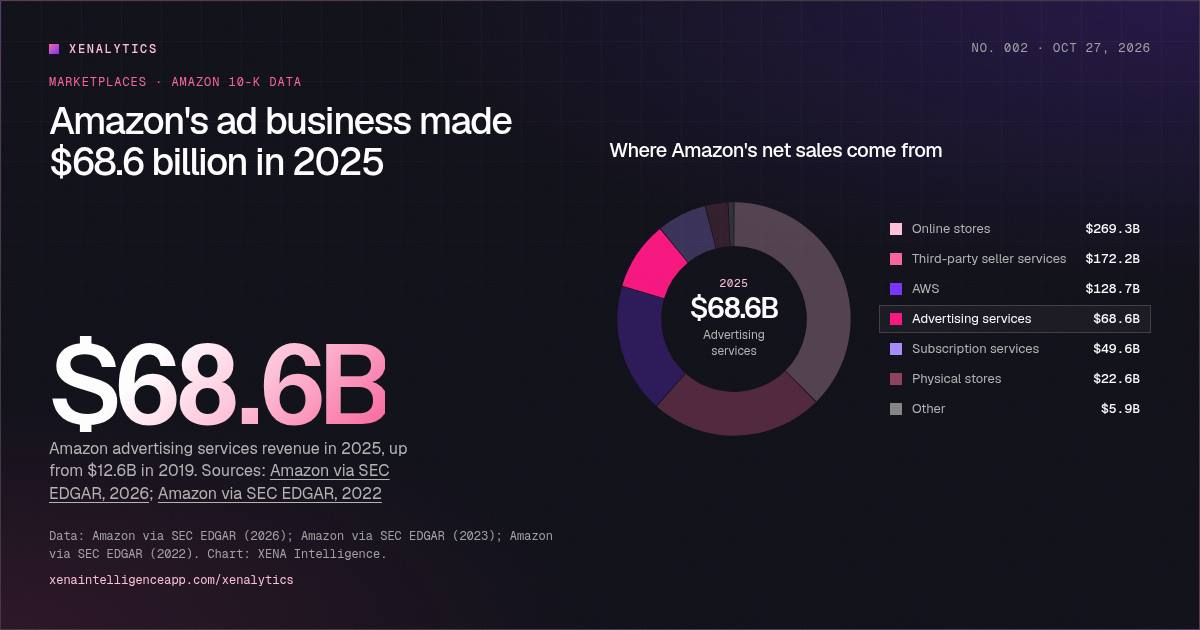
Most people still think of Amazon as a store. Its income statement tells a more complicated story. In 2025, Amazon reported $716.9 billion in net sales. Its own online-store sales, the products Amazon buys and sells itself, were $269.3 billion, or 37.6% of the total.
The rest came from businesses built around that store: fees from third-party sellers ($172.2B), Amazon Web Services ($128.7B), subscriptions such as Prime ($49.6B), physical stores including Whole Foods Market ($22.6B), and advertising ($68.6B).
Drag the year slider on the donut above and watch the pink advertising slice grow. In 2019 it was $12.6 billion, 4.5% of net sales. By 2025 it was 9.6%.
Guess: how much did Amazon earn from advertising in 2025?
Answer: $68.6B. $68.6 billion, per Amazon's 2025 10-K. That is 9.6% of Amazon's net sales and more than it made from Prime and other subscriptions ($49.6B).
Source: Amazon via SEC EDGAR, 2026
Ads are the fastest-growing major line
Over six years, advertising revenue grew 5.4 times, a compound annual growth rate of about 32.6%. No other major Amazon business grew as fast: AWS grew 3.7 times, third-party seller services 3.2 times, and Amazon's own online-store sales 1.9 times.
The growth race, 2019 → 2025
Sort Amazon's business lines by growth multiple, compound annual growth, 2025 growth, or 2025 size.
Data table
| Item | Growth multiple | CAGR | 2025 growth | 2025 size |
|---|---|---|---|---|
| Online stores | 1.9× | 11.4% | +9.0% | $269.3B |
| Third-party seller services | 3.2× | 21.4% | +10.3% | $172.2B |
| AWS | 3.7× | 24.2% | +19.7% | $128.7B |
| Advertising services | 5.4× | 32.6% | +22.1% | $68.6B |
| Subscription services | 2.6× | 17.1% | +11.8% | $49.6B |
| Physical stores | 1.3× | 4.6% | +6.3% | $22.6B |
| Other | 4.1× | 26.3% | +9.4% | $5.9B |
Growth hasn't slowed much as the business has grown. Advertising revenue rose 22.1% in 2025, nearly twice as fast as Amazon's total net sales (+12.4%). In the fourth quarter of 2025 alone, Amazon reported $21.3 billion of ad revenue, up 23% from a year earlier.
A useful milestone: 2022 was the first year Amazon earned more from advertising ($37.7B) than from subscriptions ($35.2B), Prime included. The gap has widened every year since. By 2025, ads brought in $19 billion more than subscriptions.
Each business line, year by year
Tap the legend to show or hide a line. Switch to indexed to compare growth rates.
Data table
| Period | $ billions: Online stores | $ billions: Third-party seller services | $ billions: AWS | $ billions: Advertising services | $ billions: Subscription services | $ billions: Physical stores | Indexed (2019 = 100): Online stores | Indexed (2019 = 100): Third-party seller services | Indexed (2019 = 100): AWS | Indexed (2019 = 100): Advertising services | Indexed (2019 = 100): Subscription services | Indexed (2019 = 100): Physical stores |
|---|---|---|---|---|---|---|---|---|---|---|---|---|
| 2019 | $141.2B | $53.8B | $35.0B | $12.6B | $19.2B | $17.2B | 100 | 100 | 100 | 100 | 100 | 100 |
| 2020 | $197.3B | $80.5B | $45.4B | $19.8B | $25.2B | $16.2B | 140 | 150 | 130 | 157 | 131 | 94 |
| 2021 | $222.1B | $103.4B | $62.2B | $31.2B | $31.8B | $17.1B | 157 | 192 | 178 | 247 | 165 | 99 |
| 2022 | $220.0B | $117.7B | $80.1B | $37.7B | $35.2B | $19.0B | 156 | 219 | 229 | 299 | 183 | 110 |
| 2023 | $231.9B | $140.1B | $90.8B | $46.9B | $40.2B | $20.0B | 164 | 261 | 259 | 372 | 209 | 117 |
| 2024 | $247.0B | $156.1B | $107.6B | $56.2B | $44.4B | $21.2B | 175 | 290 | 307 | 445 | 231 | 123 |
| 2025 | $269.3B | $172.2B | $128.7B | $68.6B | $49.6B | $22.6B | 191 | 320 | 368 | 544 | 258 | 131 |
Switch the line chart to Indexed (2019 = 100) and the story is plain. Every line starts at the same point, so you can compare growth directly. Advertising pulls away from the pack, AWS follows, and the online-stores line rises much more slowly.
Why Amazon's ads grew so fast
Amazon's advertising services include sponsored product listings, display ads and video ads, sold to sellers, vendors, publishers, authors and others. Three things make this business different from most media companies.
The ads sit at the point of purchase. A sponsored listing on an Amazon search results page reaches a shopper who has already typed what they want to buy. That makes Amazon's ad inventory unusually valuable to brands, and unusually easy to measure.
The marketplace creates the demand. Amazon said independent sellers accounted for 61% of units sold in Q4 2025. Millions of sellers competing for the same search results is exactly the condition that drives up demand for sponsored placement. Seller services revenue and ad revenue grow together.
The audience keeps growing. Amazon has extended its advertising beyond its own store, including video ads on Prime Video. That adds reach outside the shopping search results.
What it means for e-commerce and CPG brands
For brands that sell on Amazon, these numbers point to an uncomfortable fact: visibility on the world's largest marketplace is increasingly something you buy. Every dollar in the advertising slice of the donut was paid by a seller, vendor or other advertiser, often the same brands that also pay referral and fulfillment fees.
That has three practical consequences.
- Organic visibility is harder to earn. Sponsored placements take up a growing share of the most valuable positions on a search results page. Product listings need stronger content, reviews and conversion rates just to hold their ground.
- Retail media is now a core marketing budget line. It is no longer an experiment funded from trade spend. It needs the same planning, measurement and creative discipline as search or social.
- Measurement matters more than ever. When most visibility is paid, brands need to know which keywords, products and placements actually drive profitable sales, and which just buy back traffic they would have earned anyway.
A note on what these numbers are
All figures are net sales as reported in Amazon's annual 10-K filings, grouped the way Amazon groups them. "Third-party seller services" counts the commissions and fulfillment and shipping fees Amazon collects from sellers. It does not count the full value of the goods those sellers sell. AWS is shown for context, though it has nothing to do with retail. It is also Amazon's profit engine, earning $45.6 billion of Amazon's $80.0 billion total operating income in 2025.
Shares of total, growth multiples and compound annual growth rates are XENA calculations from the reported figures. Exact values for every year and segment are in the data table below each chart and in this page's dataset.
The takeaway
Amazon has become, among other things, one of the world's largest advertising businesses, and its ad inventory is the digital shelf itself. For brands, winning on Amazon now means managing three things together: catalog content that converts, advertising that is measured carefully, and a clear view of which channels drive profitable growth across Amazon, Walmart, your own site and the search and AI tools where shopping journeys start.
Methodology and notes
- All figures are reported net sales in US dollars, in billions, rounded to one decimal. Amazon's groups are defined by Amazon. Advertising services includes sponsored ads, display and video advertising.
- Third-party seller services covers commissions and fulfillment and shipping fees paid by marketplace sellers, not the full value of goods those sellers sell.
- Growth multiples, CAGR and shares of total are XENA calculations from the reported figures.
- Charts, rankings and calculated figures (growth rates, multiples, gaps) are XENA Intelligence calculations from the sources below. Estimates and forecasts are labelled as such.
Sources
- Amazon via SEC EDGAR (2026). Amazon.com, Inc. Form 10-K for 2025: net sales by groups of similar products and services
- Amazon via SEC EDGAR (2023). Amazon.com, Inc. Form 10-K for 2022: disaggregation of revenue
- Amazon via SEC EDGAR (2022). Amazon.com, Inc. Form 10-K for 2021: disaggregation of revenue (2019–2021)
- Amazon via SEC EDGAR, exhibit 99.1 (2026). Amazon.com announces fourth quarter results (Q4 2025)
Cite this infographic
Free to cite and share with a link back to this page.
Embed this infographic
Paste this code into your site or newsletter. The embed is interactive and links back to the full analysis.