On this page
The Shopify economy, measured
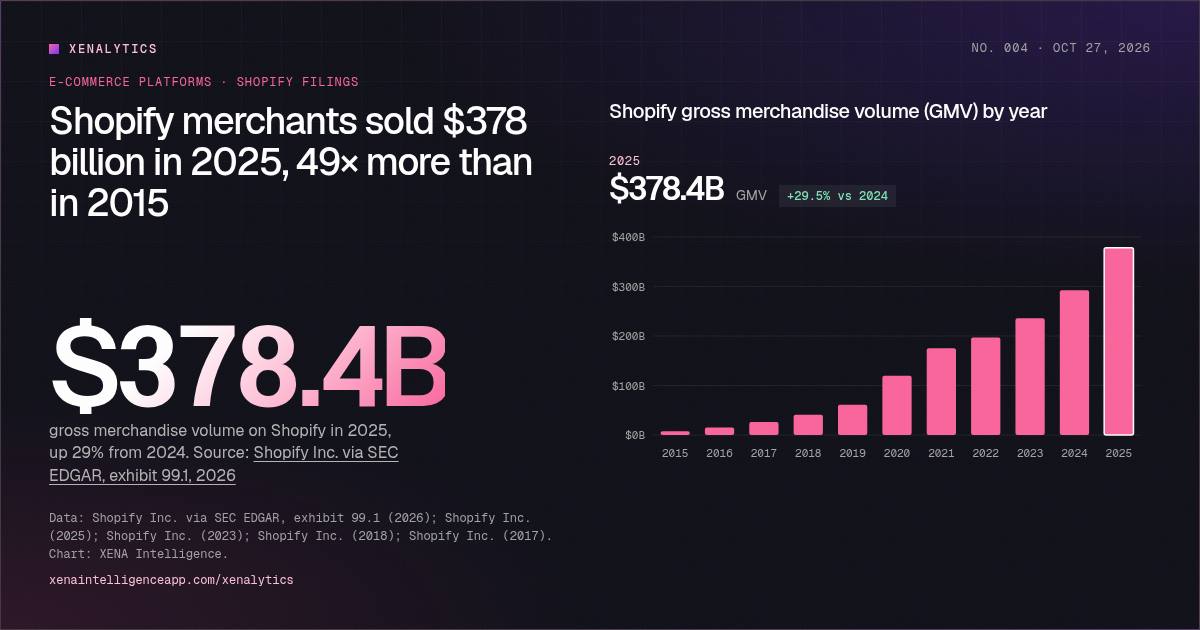
Shopify doesn't sell products. Its merchants do. Gross merchandise volume (GMV) is the total value of orders placed through the platform, and it is the best single measure of how much commerce now runs on Shopify. In 2025, GMV reached $378.4 billion, up 29% from $292.3 billion in 2024.
Ten years earlier, it was about $7.7 billion. That is 49 times smaller. Press play on the chart above to watch the decade unfold.
Guess: how much merchandise did Shopify merchants sell in 2025?
Answer: $378.4B. $378.4 billion in gross merchandise volume, up 29% from 2024 and about 3× 2020, per Shopify's Q4 2025 release.
Three phases of growth
Switch the chart to YoY growth and three phases appear.
2016–2019: doubling, then compounding. GMV doubled in 2016 (+99%) and kept growing between 49% and 71% a year as small businesses and direct-to-consumer brands moved onto the platform.
2020–2021: the pandemic surge. With stores closed, GMV nearly doubled in 2020, from $61.1 billion to $119.6 billion, then grew another 47% in 2021 to $175.4 billion. Few companies benefited more from the shift online.
2022–2026: slowdown, then re-acceleration. After the reopening, growth fell to 12% in 2022. Then it did something unusual for a platform of its size: it sped up again. Shopify reports GMV growth of 20% in 2023, 24% in 2024 and 29% in 2025. In the second quarter of 2026, GMV was $115.6 billion, up 32% from $87.8 billion a year earlier.
Compare any two years
How many times bigger is the Shopify economy?
Data table
| Period | Value |
|---|---|
| 2015 | $7.7B |
| 2016 | $15.4B |
| 2017 | $26.3B |
| 2018 | $41.1B |
| 2019 | $61.1B |
| 2020 | $119.6B |
| 2021 | $175.4B |
| 2022 | $197.2B |
| 2023 | $235.9B |
| 2024 | $292.3B |
| 2025 | $378.4B |
Use the comparison tool to choose any two years. From 2020 to 2025, GMV grew about 3.2 times. Shopify itself describes 2025 GMV as "3x greater" than 2020.
Where the growth is coming from
Shopify's 2025 results point to several engines beyond its core of small online stores.
What grew fastest at Shopify in 2025
Growth versus 2024, as reported by Shopify.
Data table
| Item | 2025 growth |
|---|---|
| B2B GMV | +96% |
| Shop Pay GMV | +62% |
| Gross payments volume | +37% |
| International revenue | +36% |
| Total revenue | +30% |
| Total GMV | +29% |
| Offline revenue | +27% |
- B2B (wholesale sales by brands to businesses) grew GMV 96%. Shopify notes it is still a very small part of total GMV, but it is the fastest-growing line.
- Shop Pay, Shopify's accelerated checkout, grew GMV 62%. It now helps carry shoppers across many independent stores, not just one.
- International revenue grew 36%, so growth is no longer mainly a North American story.
- Offline revenue, from in-store point-of-sale (POS) payments, plans and hardware, grew 27% as merchants use one system for stores and websites.
- Gross payments volume grew 37%, faster than GMV, as more merchants use Shopify Payments.
Share of US e-commerce
Shopify estimates that its merchants accounted for more than 14% of US e-commerce in 2025. That is a company estimate, not an independent measurement. Shopify builds it from unadjusted Census data and internal estimates, and it excludes merchants' in-store POS sales. Still, if it is roughly right, Shopify-powered stores together are one of the largest online "retailers" in the country, made up of millions of independent businesses.
For context, the US Census Bureau puts all US e-commerce at 17.1% of total retail sales in Q2 2026. See Xenalytics No. 001 for the full 27-year history.
GMV is not revenue
One common misunderstanding: GMV is the value of merchants' sales, not Shopify's income. Shopify's 2025 revenue was $11.6 billion, about 3% of GMV, earned mainly from subscriptions and from merchant solutions such as payments. The comparison still matters. Shopify earns more when its merchants sell more, so the company is built to make independent brands grow.
What it means for brands
The Shopify chart is, in a sense, a chart of brands taking control of their own sales channels. Each order counted in GMV happened on a storefront the brand controls: its own design, its own customer relationship, its own data.
That independence comes with responsibility. A marketplace listing benefits from the marketplace's traffic; a brand's own store has to bring in its own visitors. Three implications follow:
- Discovery is the bottleneck. A brand's store can convert well and still be invisible. Search engines, social platforms and, increasingly, AI assistants decide which brands shoppers ever see.
- First-party data is the advantage. Shopify merchants own their customer data. The brands that use it well, for retention, lifecycle email and new products, compound faster.
- Channel mix is a strategic choice. Most growing brands sell in several places: their own store, Amazon, Walmart, social commerce and wholesale. You need to see how all of them perform together, not one dashboard at a time.
Methodology
GMV figures come from Shopify's annual results releases and SEC filings. Shopify defines GMV as the total dollar value of orders facilitated through the Shopify platform, including certain apps and channels where a revenue-sharing arrangement is in place, net of refunds, and including shipping and handling, duty and value-added taxes. The 2015 figure ($7.7B) is derived from Shopify's statement that 2016 GMV of $15.4 billion was up 99%. Growth rates after 2016 are calculated from GMV rounded to the nearest $0.1 billion and match Shopify's reported rates to within a point. GMV is global; Shopify does not report total GMV by country.
Methodology and notes
- GMV is the total dollar value of orders facilitated through Shopify, net of refunds and including shipping and handling, duty and value-added taxes. It is not Shopify's revenue, which was $11.6B in 2025.
- GMV is global. The >14% US e-commerce share is Shopify's own estimate, combining unadjusted Census data with internal estimates and excluding point-of-sale sales. It is not an independent measurement.
- 2015 GMV ($7.7B) is derived from Shopify's statement that 2016 GMV of $15.4B was up 99%. Growth rates here are calculated from GMV rounded to $0.1B and may differ by a point from Shopify's reported rates.
- Charts, rankings and calculated figures (growth rates, multiples, gaps) are XENA Intelligence calculations from the sources below. Estimates and forecasts are labelled as such.
Sources
- Shopify Inc. via SEC EDGAR, exhibit 99.1 (2026). Shopify Q4 and full-year 2025 financial results
- Shopify Inc. via SEC EDGAR, exhibit 99.1 (2026). Shopify Q2 2026 financial results
- Shopify Inc. (2025). Shopify Q4 and full-year 2024 financial results
- Shopify Inc. (2023). Shopify announces fourth-quarter and full-year 2022 financial results
- Shopify Inc. (2018). Shopify announces fourth-quarter and full year 2017 financial results
- Shopify Inc. (2017). Shopify announces fourth-quarter and full year 2016 financial results
Cite this infographic
Free to cite and share with a link back to this page.
Embed this infographic
Paste this code into your site or newsletter. The embed is interactive and links back to the full analysis.