On this page
A $7 lipstick brand that kept compounding
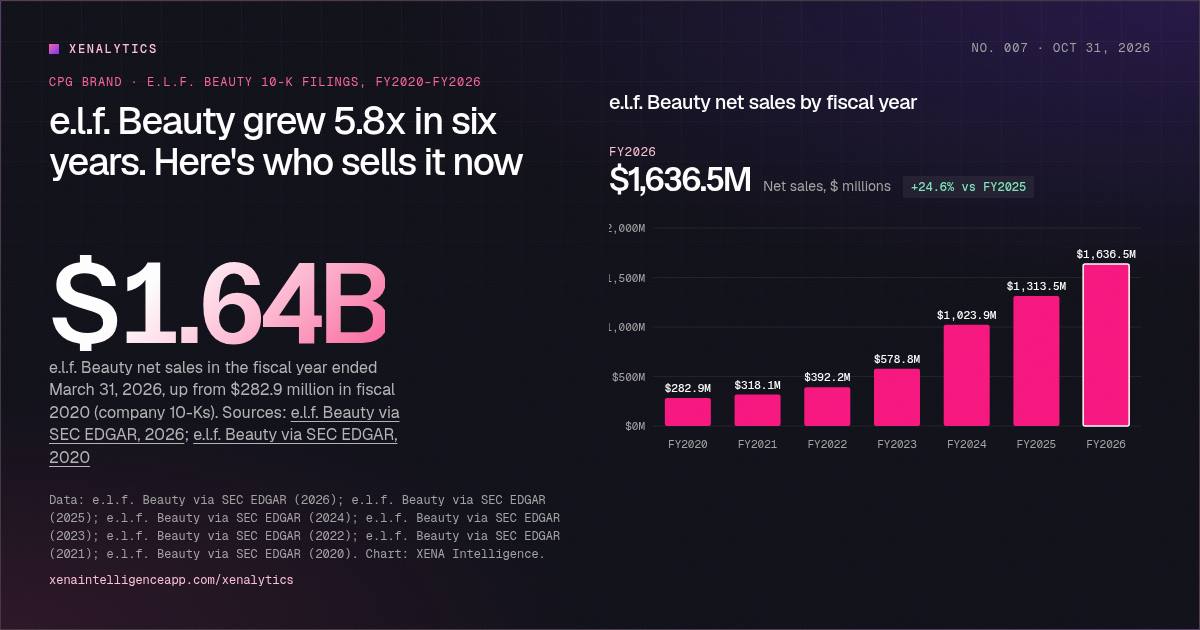
In the fiscal year that ended March 31, 2020, e.l.f. Beauty sold $282.9 million worth of makeup and skin care. Six fiscal years later the number was $1,636.5 million. That's about 5.8 times bigger, and the company says fiscal 2026 was its seventh straight year of growth in both net sales and market share. In the quarter ended June 30, 2026, net sales rose 36% to $479.4 million, which e.l.f. called its 30th consecutive quarter of growth. It then raised its fiscal 2027 outlook to $1,938 million to $1,968 million.
Use the toggle on the chart above to split the total into United States and International. The US business is still most of it, at $1,292.4 million last year. International grew faster, though: from $27.6 million to $344.1 million, about 12 times. Outside the US, the 10-K names the UK, Canada and Germany as the main markets. International was 10% of sales in fiscal 2020 and 21% in fiscal 2026.
Price is a big part of how e.l.f. got here. Citing Nielsen, the company says its e.l.f. Cosmetics products average about $7 in the US. Other leading mass cosmetics brands average $10 and prestige brands average $30. Nielsen counted four of the top 10 new products in all of mass cosmetics in 2025 as e.l.f.'s, after six in 2024.
The customer list changed more than the headline did
The more useful chart for anyone selling a consumer brand is built from a short note in each 10-K: which customers made up 10% or more of net sales.
Share of e.l.f. net sales by retailer
Only customers at 10% or more are disclosed, so gaps mean below 10%. Tap the legend to hide a line, or switch to estimated dollars.
Data table
| Period | % of net sales: Target | % of net sales: Walmart | % of net sales: Ulta Beauty | % of net sales: Amazon | % of net sales: Sephora | Est. $ millions: Target | Est. $ millions: Walmart | Est. $ millions: Ulta Beauty | Est. $ millions: Amazon | Est. $ millions: Sephora |
|---|---|---|---|---|---|---|---|---|---|---|
| FY2020 | 22% | 31% | n/a | n/a | n/a | $62M | $88M | n/a | n/a | n/a |
| FY2021 | 22% | 26% | n/a | n/a | n/a | $70M | $83M | n/a | n/a | n/a |
| FY2022 | 23% | 26% | 12% | n/a | n/a | $90M | $102M | $47M | n/a | n/a |
| FY2023 | 25% | 20% | 15% | n/a | n/a | $145M | $116M | $87M | n/a | n/a |
| FY2024 | 25% | 17% | 16% | n/a | n/a | $256M | $174M | $164M | n/a | n/a |
| FY2025 | 23% | 16% | 12% | 12% | n/a | $302M | $210M | $158M | $158M | n/a |
| FY2026 | 18% | 13% | n/a | 11% | 10% | $295M | $213M | n/a | $180M | $164M |
In fiscal 2020, Walmart (31%) and Target (22%) made up 53% of e.l.f.'s net sales between them. By fiscal 2026 the two together were down to 31%. Neither retailer shrank as an account. Switch the chart to estimated dollars and you'll see Walmart going from about $88 million to about $213 million. Target went from about $62 million to about $295 million, roughly where it was a year earlier. The rest of the business simply grew faster around them.
Three other names show up along the way. Ulta Beauty crossed 10% in fiscal 2022, peaked at 16% in fiscal 2024, then fell below the disclosure line in fiscal 2026. Amazon first appears at 12% in fiscal 2025 and was 11% last year, which makes it e.l.f.'s third-largest customer. Sephora appears for the first time in fiscal 2026, at 10%.
One caution on the gaps. A missing point means the retailer was under 10% or not separately disclosed. It doesn't mean e.l.f. sold nothing there.
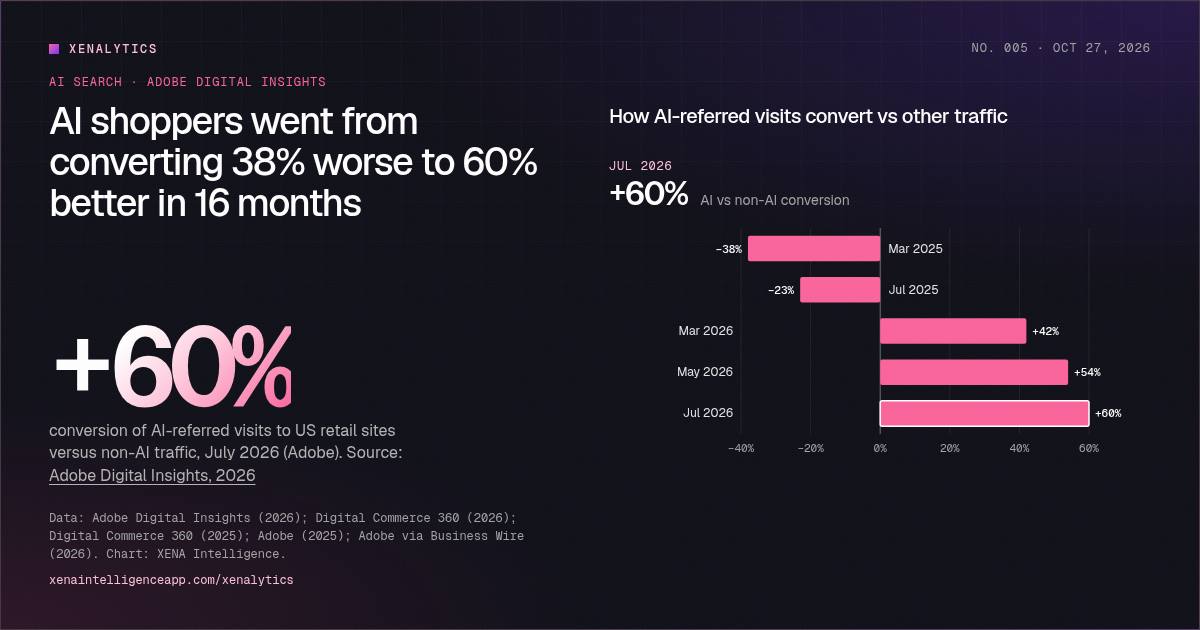
How Amazon reached 11% matters if you run a brand on Amazon. The filings don't say whether e.l.f. sells to Amazon wholesale, sells directly to shoppers through Seller Central, or both. They just call Amazon a customer. If you're weighing the two models for your own brand, our glossary entry on 1P vs. 3P on Amazon walks through the trade-offs. So does our look at how Amazon's own revenue mix has moved toward advertising.
Which retailer was e.l.f. Beauty's biggest customer in fiscal 2026?
Answer: Target. Target, at 18% of net sales, per the fiscal 2026 10-K. Walmart was 13%, Amazon 11% and Sephora 10%. Ulta Beauty, at 16% two years earlier, fell below the 10% disclosure line.
Sources: e.l.f. Beauty via SEC EDGAR, 2026; e.l.f. Beauty via SEC EDGAR, 2024
E-commerce went from a side channel to a quarter of sales
The 10-K also splits net sales between national and international retailers and e-commerce. Drag the slider to watch the e-commerce slice grow.
Retailers vs. e-commerce
Share of net sales by channel. Drag the year slider or press play.
Data table
| Year | National and international retailers | E-commerce channels | Total |
|---|---|---|---|
| FY2020 | 92% | 8% | 100% |
| FY2021 | 86% | 14% | 100% |
| FY2022 | 90% | 10% | 100% |
| FY2023 | 88% | 12% | 100% |
| FY2024 | 84% | 16% | 100% |
| FY2025 | 83% | 17% | 100% |
| FY2026 | 76% | 24% | 100% |
E-commerce channels were 24% of net sales in fiscal 2026, up from 17% the year before. In fiscal 2020, direct-to-consumer e-commerce was 8%. Fiscal 2021, which ran from April 2020 to March 2021, spiked to 14% before easing back to 10%. The bigger move came in the last two years.
The definition did change along the way, and you should know that before comparing the endpoints. Through fiscal 2022 the filings call the second slice direct-to-consumer e-commerce. From fiscal 2023 they say e-commerce channels. In fiscal 2020 e.l.f. also estimated that all digital sales, including retailer websites and Amazon, were about 11%, a few points above its own DTC number. So the trend is real, but the 8% and 24% don't measure exactly the same thing.
e.l.f. Cosmetics is, in its words, the only top five mass cosmetics brand with its own direct-to-consumer e-commerce site. Its products are also sold on Amazon and TikTok Shop.
rhode: a DTC brand bolted onto a retail brand
The biggest single reason fiscal 2026 looks different is rhode, the skin care brand founded by Hailey Bieber. e.l.f. announced the deal in May 2025 and closed it on August 5, 2025.
Guess: how much did rhode sell in the 12 months before e.l.f. agreed to buy it?
Answer: $212M. $212 million in net sales in the 12 months ended March 31, 2025, per e.l.f.'s May 2025 deal announcement. At the time rhode sold through its own site, rhodeskin.com. e.l.f. agreed to pay up to $1 billion: $800 million at closing plus up to $200 million in earnout.
The price was up to $1 billion: $800 million at closing plus up to $200 million more over three years if rhode hits its targets. At the time, rhode sold through its own website, and e.l.f. said it planned a first store launch with Sephora in North America and the UK. Once part of e.l.f., rhode made up about 18% of fiscal 2026 net sales, according to the 10-K. That works out to roughly $295 million (our calculation) for less than eight months of ownership.
Put the pieces together and the channel shift makes sense. A brand built on its own site raised e-commerce's share. A planned Sephora launch lines up with Sephora reaching 10%. And Target and Walmart, still the two biggest accounts, became a smaller share of a much bigger company.
Compare any two years
Compare any two fiscal years
How many times bigger is e.l.f. Beauty?
Data table
| Period | Value |
|---|---|
| FY2020 | $282.9M |
| FY2021 | $318.1M |
| FY2022 | $392.2M |
| FY2023 | $578.8M |
| FY2024 | $1,023.9M |
| FY2025 | $1,313.5M |
| FY2026 | $1,636.5M |
Pick fiscal 2020 and fiscal 2026 for the full 5.8 times. Pick fiscal 2023 and fiscal 2024 for the single biggest jump, a 77% increase in one year.
What it means for brands
Most CPG brands want to move from one or two big store accounts to a wider mix, and e.l.f. shows what that looks like. Target and Walmart still mattered; they just stopped being the whole story. Amazon became a 10% customer, the brand's own site and other e-commerce channels reached a quarter of sales, and a newer retailer came in through an acquisition.
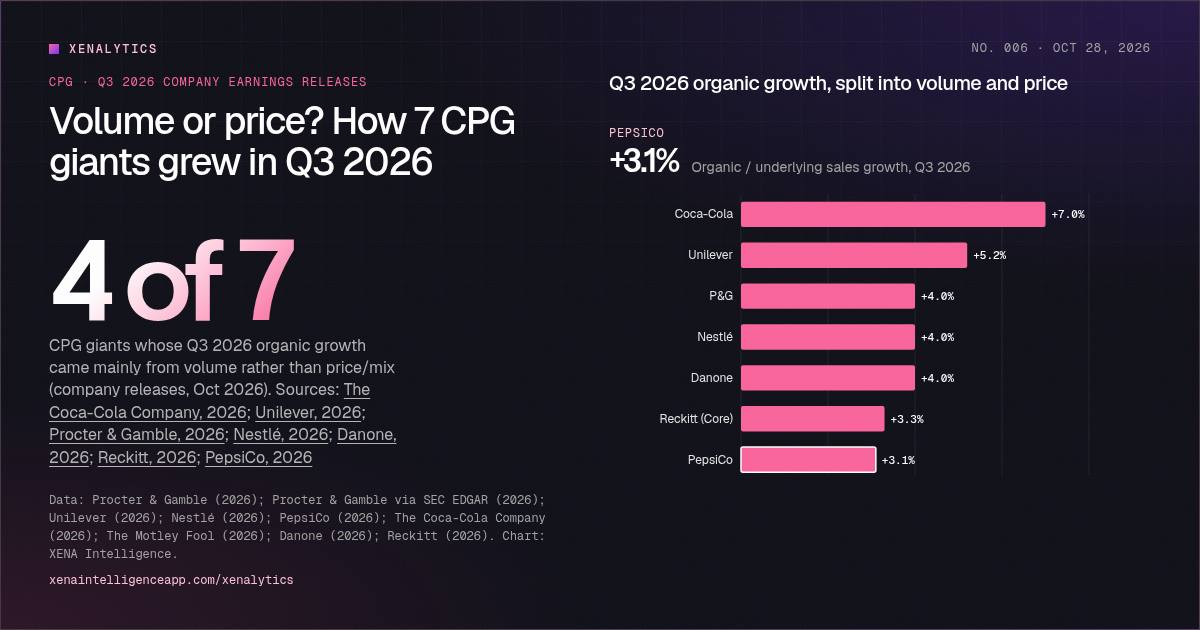
Each of those channels needs different work. Amazon brings content, reviews, the Buy Box and retail media. TikTok Shop runs on creators. Your own site is mostly about conversion. Few teams can see all of it in one place, which is why unified marketplace data matters. For a wider view of how big CPG companies are growing right now, see our breakdown of volume vs. price at the CPG giants. Our store brands chart covers the private-label competition at the same retailers.
XENA's team runs marketplaces like these day to day for more than 120 brands through XENA 360, so a brand's online presence can grow with its distribution.
Methodology
Annual net sales, the US and international split, channel shares and customer shares all come from e.l.f. Beauty's Form 10-K filings for fiscal 2020 through fiscal 2026, which are linked below. Fiscal years end March 31. Where a later 10-K restated an earlier year, we use the later figure. That applies to the fiscal 2021 international number. Customer dollar figures and the rhode dollar estimate are our calculations from disclosed percentages, so they carry rounding error. The quarterly figures and the fiscal 2027 outlook come from e.l.f.'s August 5, 2026 earnings release. e.l.f. had not reported its September 2026 quarter when we wrote this, and we'll update the piece when it does.
Methodology and notes
- e.l.f. Beauty's fiscal year ends March 31. FY2026 means April 1, 2025 to March 31, 2026. All annual figures are from the company's 10-K filings; where a later 10-K restated an earlier year (fiscal 2021 US and international split), we use the later figure.
- Customer shares are only disclosed for customers at 10% or more of net sales. A gap in the line means that retailer was below 10% that year or not separately disclosed, not that it was zero. Ulta Beauty was 12% in fiscal 2025 and below 10% in fiscal 2026.
- Dollar figures by customer are XENA estimates: the disclosed percentage (rounded to a whole number) times total net sales. A rounding error of half a point equals about $8 million in fiscal 2026, so small year-to-year changes are within the margin.
- The channel split changed wording over time. The fiscal 2020 to 2022 10-Ks describe the non-retailer slice as direct-to-consumer e-commerce; from fiscal 2023 the filings say e-commerce channels. In fiscal 2020 the company also estimated total digital sales, including retailer websites and Amazon.com, at about 11%. Amazon sales may sit in either slice depending on how they are sold, and the filings do not say.
- rhode was acquired on August 5, 2025. The 10-K says it made up about 18% of fiscal 2026 net sales; the roughly $295 million figure is our calculation from that percentage.
- Charts, rankings and calculated figures (growth rates, multiples, gaps) are XENA Intelligence calculations from the sources below. Estimates and forecasts are labelled as such.
Glossary terms in this article
Sources
- e.l.f. Beauty via SEC EDGAR (2026). e.l.f. Beauty Form 10-K for the fiscal year ended March 31, 2026
- e.l.f. Beauty via SEC EDGAR (2025). e.l.f. Beauty Form 10-K for the fiscal year ended March 31, 2025
- e.l.f. Beauty via SEC EDGAR (2024). e.l.f. Beauty Form 10-K for the fiscal year ended March 31, 2024
- e.l.f. Beauty via SEC EDGAR (2023). e.l.f. Beauty Form 10-K for the fiscal year ended March 31, 2023
- e.l.f. Beauty via SEC EDGAR (2022). e.l.f. Beauty Form 10-K for the fiscal year ended March 31, 2022
- e.l.f. Beauty via SEC EDGAR (2021). e.l.f. Beauty Form 10-K for the fiscal year ended March 31, 2021
- e.l.f. Beauty via SEC EDGAR (2020). e.l.f. Beauty Form 10-K for the fiscal year ended March 31, 2020
- e.l.f. Beauty via SEC EDGAR (2026). e.l.f. Beauty Announces Fourth Quarter and Full Fiscal 2026 Results (May 20, 2026), Exhibit 99.1
- e.l.f. Beauty via SEC EDGAR (2026). e.l.f. Beauty Announces First Quarter Fiscal 2027 Results (August 5, 2026), Exhibit 99.1
- e.l.f. Beauty via SEC EDGAR (2025). e.l.f. Beauty Announces Fourth Quarter and Full Fiscal 2025 Results (May 28, 2025), Exhibit 99.2
- e.l.f. Beauty via SEC EDGAR (2025). e.l.f. Beauty Announces Definitive Agreement to Acquire rhode in $1 Billion Deal (May 28, 2025)
Cite this infographic
Free to cite and share with a link back to this page.