One interactive infographic every day on how people shop and what brands sell. Each one comes with a short article that explains the numbers, and every number links to its source.
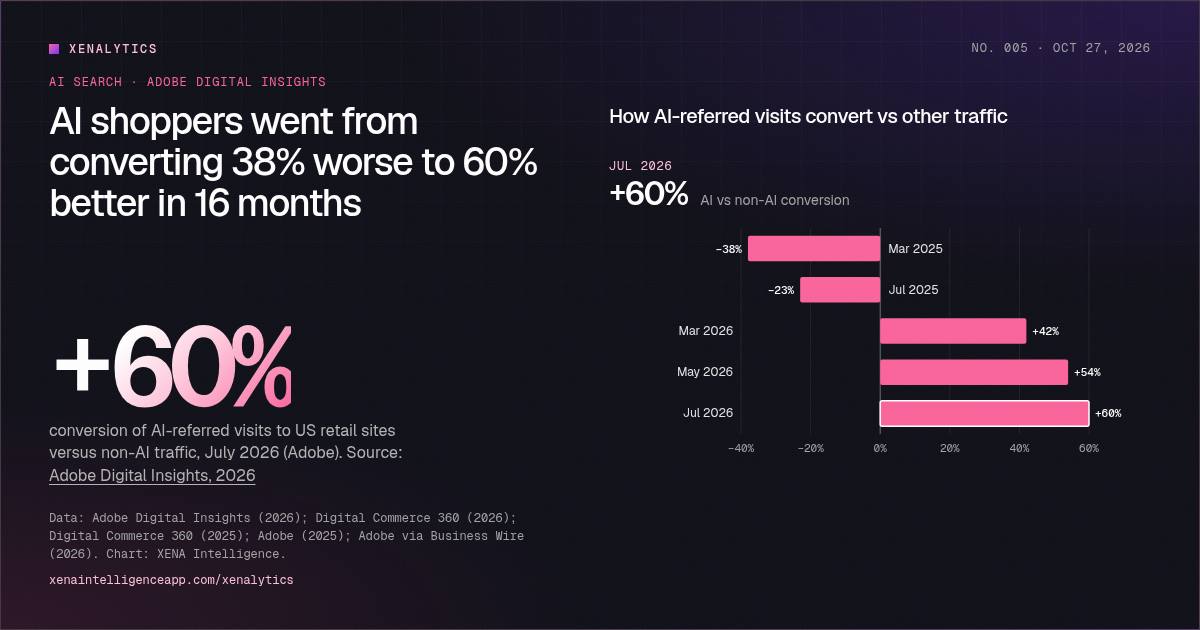
+60%conversion of AI-referred visits to US retail sites versus non-AI traffic, July 2026 (Adobe)
Traffic from ChatGPT-style assistants to US retail sites is still growing fast. The bigger story is quality: AI-referred shoppers now buy more often than everyone else.
Traffic from ChatGPT-style assistants to US retail sites is still growing fast. The bigger story is quality: AI-referred shoppers now buy more often than everyone else.
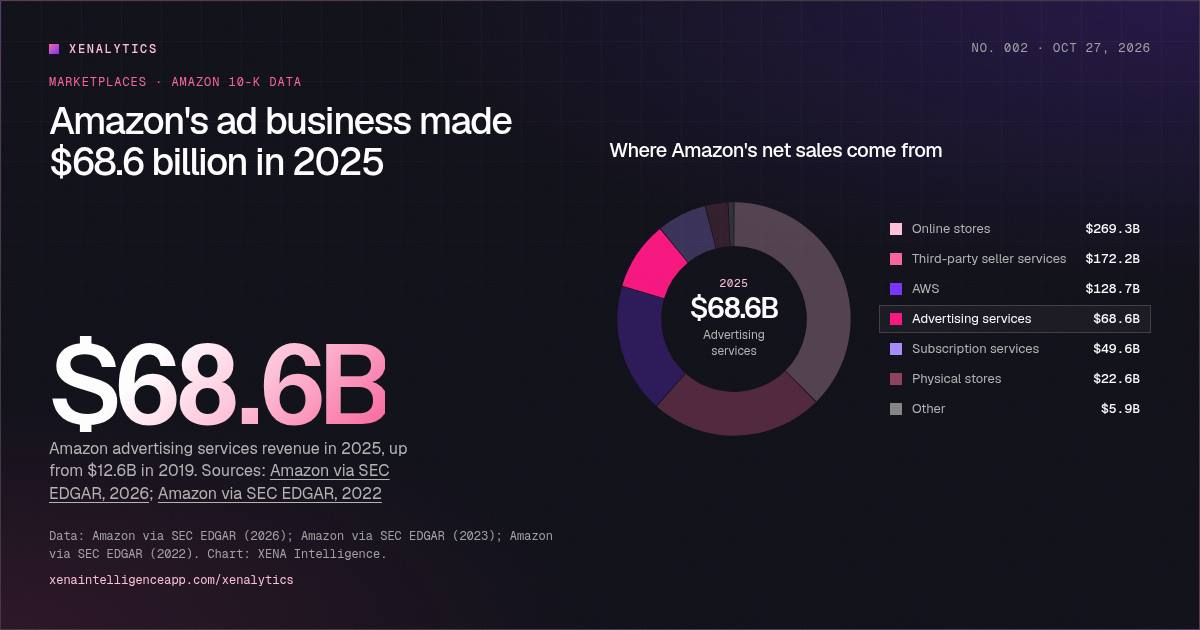
Advertising is now Amazon's fastest-growing major business line. It is bigger than Prime and other subscriptions, and it is built on the same shelf your brand competes on.
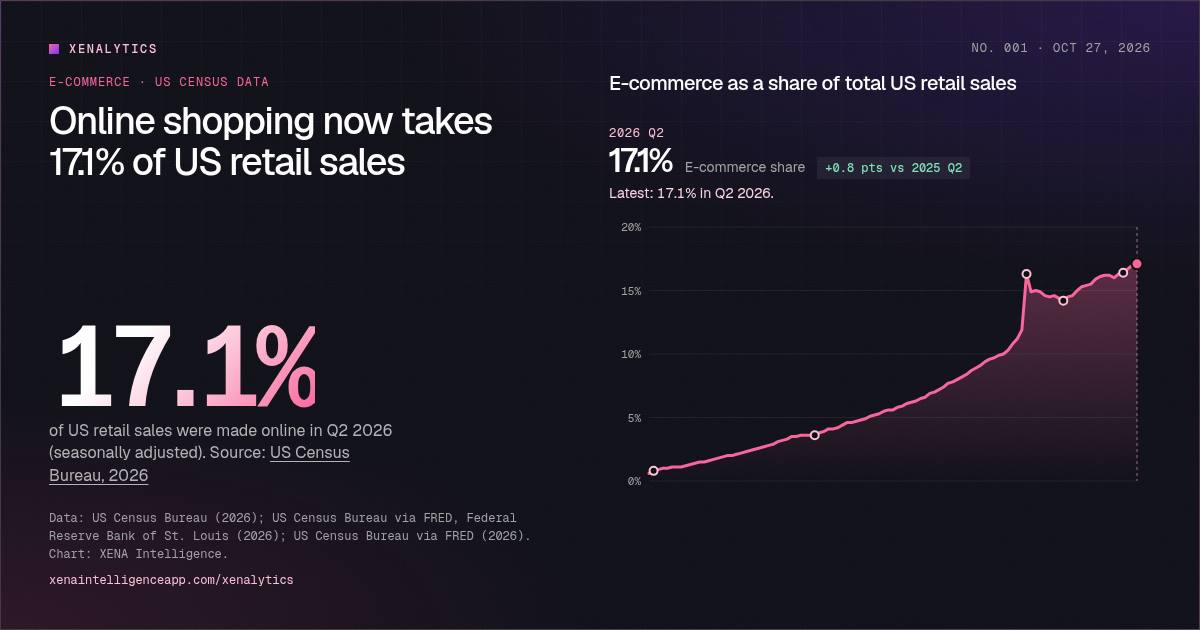
Twenty-seven years of US Census data show online's share of retail rising steadily, jumping during the pandemic, then dipping, and now setting new records again.
·4 min read·Interactive
01 · SOURCEDEvery number has a link.
We use public filings, government statistics and published industry research. Each chart names its source and year, estimates are labelled, and where sources disagree we say so.
02 · INTERACTIVEExplore, don't just look.
Scrub through time, switch measures, sort rankings, find your category and test what you know. Every chart has a data table you can read or download.
03 · SHAREABLEFree to share, cite and embed.
Download the PNG, copy a citation or embed the interactive version on your site. Just link back. Suggest a topic.
Next step
Find out which of your products AI recommends.
Score a product across ChatGPT, Gemini, Perplexity, Copilot and Google AI Overviews with a free SearchPanel audit. Or book a meeting and we'll walk through a live AI Visibility Score with you.