On this page
From curiosity to customers
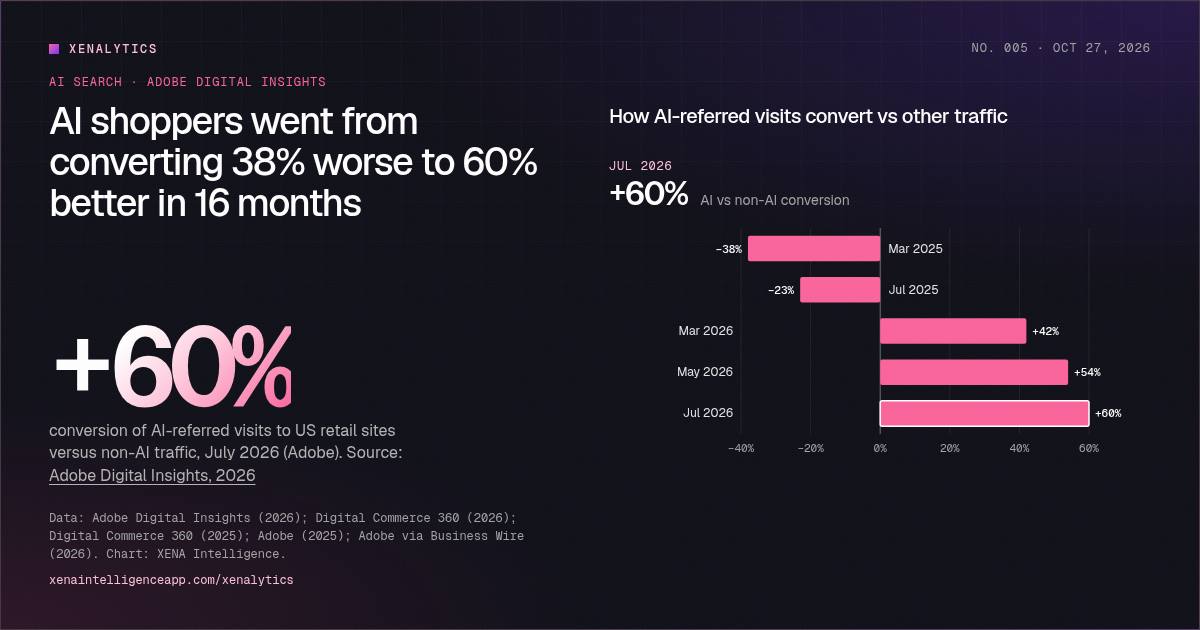
When shoppers first started clicking links from ChatGPT-style assistants to retail websites, the traffic was large in percentage terms but weak in commercial terms. Adobe, which analyzes more than a trillion visits to US retail sites, found that in March 2025 AI-referred visitors were 38% less likely to buy than visitors from other channels such as paid search and email.
Sixteen months later, that had flipped. In July 2026, AI-referred visits converted 60% better than non-AI traffic, the eleventh straight month AI traffic came out ahead.
In March 2025, how did AI-referred shoppers convert compared with other visitors?
Answer: 38% worse. 38% worse. A year later, in March 2026, they converted 42% better, and by July 2026, 60% better (Adobe).
Source: Adobe Digital Insights, 2026
That reversal, from 38% worse to 60% better, is the most important fact in AI shopping right now. It means AI assistants are no longer just a research toy. They send shoppers who are ready to buy.
Engagement tells the same story
Adobe's other measures point the same way. In July 2026, visitors arriving from AI sources spent 59% more time on retail sites, bounced 33% less and added items to their carts 28% more often than other visitors. Adobe also found these visitors generated 53% more revenue per visit.
The likely reason is simple. A shopper who asks an assistant for "the best waterproof hiking boots under $150" arrives on a product page with most of the research already done. The assistant has narrowed the choices; the website just has to close the sale.
Traffic is still growing, just from a bigger base
Year-over-year growth in AI traffic to US retail sites
As reported by Adobe for each period. Periods differ in length, so compare with care. Striped = forecast.
Data table
| Period | YoY growth |
|---|---|
| Holiday 2024 | +1,300% |
| Jul 2025 | +4,700% |
| Holiday 2025 | +693% |
| Q1 2026 | +393% |
| May 2026 | +138% |
| Jul 2026 | +62% |
| Holiday 2026* (forecast) | +130% |
Adobe's traffic growth figures look dramatic, and they need careful reading. Each bar covers a different period: holiday seasons, single months or a quarter. The very large early figures (+1,300% in the 2024 holiday season and +4,700% in July 2025) reflect a tiny starting base.
As the base has grown, the percentages have come down: +393% in the first quarter of 2026, +138% in May and +62% in July. A smaller percentage of a much larger base still means many more visits. Adobe says AI traffic to US retail sites in May 2026 was up 1,324% from October 2024. Adobe forecasts AI traffic will rise another 130% during the 2026 holiday season (November–December), but that is a projection, not a measurement.
In Adobe's survey, 39% of US consumers said they had used AI for online shopping, and 85% of them said it improved their experience.
The biggest player inside a single store is moving too. Amazon said in October 2025 that 250 million customers had used its Rufus shopping assistant that year. It said customers who used Rufus during a shopping trip were 60% more likely to complete a purchase, and that Rufus was on track to deliver more than $10 billion in additional annualized sales.
The catch: AI can't read much of the store
Here is the problem for retailers and brands. AI assistants can only recommend what they can read. Adobe's AI Content Visibility Checker scores how much of a web page large language models can actually parse. A score of 66% means a third of the page is invisible to AI.
How much of a retail page can AI actually read?
Adobe AI Content Visibility Checker scores: the share of a page's content machines can read. Toggle page type or retail category.
Data table
| Item | By page type (Apr 2026) |
|---|---|
| Returns/exchanges | 82% |
| Contact us | 81% |
| FAQ | 80% |
| Customer service | 79% |
| Loyalty/membership | 78% |
| Homepage | 75% |
| Category pages | 74% |
| Store locator | 73% |
| Product pages | 66% |
| Item | Homepages by category (Jul 2026) |
|---|---|
| Apparel | 76% |
| Electronics | 70% |
| Cosmetics | 68% |
| Sporting goods | 67% |
| Furniture & home | 64% |
| General merchandise | 63% |
| Grocery | 59% |
The results are sobering. Across US retail sites in April 2026, product pages, the pages that actually make the sale, scored lowest, at 66%. Homepages averaged 75% and category pages 74%. Help, returns and FAQ pages scored higher, near 80%, which makes sense: they are mostly plain text.
Toggle to Homepages by category and grocery stands out at the bottom with 59%, below general merchandise (63%) and well below apparel (76%). For CPG brands, that is a direct warning. The shelf where your products live online is among the hardest for AI to read.
Adobe's own numbers move around. The April 2026 cohort averaged 75% for homepages, but when Adobe looked at a broader set of retail sites in July, the average fell to 61%. Whichever figure is closer to the truth, a large share of retail content is still out of AI's reach.
What brands should do now
The data suggests three priorities:
- Make product pages readable by machines. Key facts such as price, availability, specifications, ingredients, sizes and reviews should be in clean, server-rendered text and structured data, not locked inside images, scripts or tabs that only load on click.
- Measure your AI visibility, not just your traffic. Find out whether assistants mention your brand for the questions your customers ask, which competitors they recommend instead, and which sources they cite.
- Treat AI referrals as a premium channel. These visitors convert better than average. Track them separately in your analytics, and build landing experiences that close the sale quickly.
Reading the numbers carefully
All traffic and conversion figures here are from Adobe Analytics and Adobe Digital Insights reports, or from news coverage of those reports. Other analytics companies define AI referrals differently and report different growth rates, so we use only Adobe's numbers to keep the comparisons consistent. Adobe's figures don't always line up between releases. For example, its cumulative growth since October 2024 was 1,324% in May 2026 data and 1,219% in July 2026 data, possibly reflecting changes in its sample. Each number is shown with its own date and source.
Methodology and notes
- All traffic and conversion figures are from Adobe Analytics data on visits to US retail sites (Adobe cites more than 1 trillion visits). AI traffic means visits arriving from generative AI chat services and AI browsers.
- Adobe's growth figures cover different windows (holiday seasons, single months, a quarter), so the bars are not a continuous series. Holiday 2026 is a forecast.
- Adobe's numbers do not line up perfectly between releases. Its May 2026 data put growth since October 2024 at 1,324%; its July 2026 data put it at 1,219%. Its April cohort averaged a 75% homepage readability score; an expanded July cohort averaged 61%. We show each figure with its own date.
- Other analytics vendors measure AI referrals differently and report different growth rates. We use only Adobe's figures, so the series stay comparable.
- Charts, rankings and calculated figures (growth rates, multiples, gaps) are XENA Intelligence calculations from the sources below. Estimates and forecasts are labelled as such.
Sources
- Adobe Digital Insights (2026). Adobe report: US retailers see surge in AI traffic, but many websites are not entirely readable by machines
- Adobe Digital Insights (2026). AI Traffic Trends Report, August 2026
- Digital Commerce 360 (2026). Adobe: AI-referral traffic spending, converting more than counterparts
- Digital Commerce 360 (2026). Adobe: AI-referred traffic to retail sites doubles in a year
- Digital Commerce 360 (2025). Generative AI-powered shopping up 4,700% in July, Adobe found
- Adobe (2025). Generative AI-powered shopping rises with traffic to US retail sites
- Adobe via Business Wire (2026). Adobe: US holiday shopping season to hit record $275.1 billion online (2026 forecast)
- The Motley Fool (2025). Amazon Q3 2025 earnings call transcript (Rufus metrics)
Cite this infographic
Free to cite and share with a link back to this page.
Embed this infographic
Paste this code into your site or newsletter. The embed is interactive and links back to the full analysis.