On this page
A record year for the store's own brands
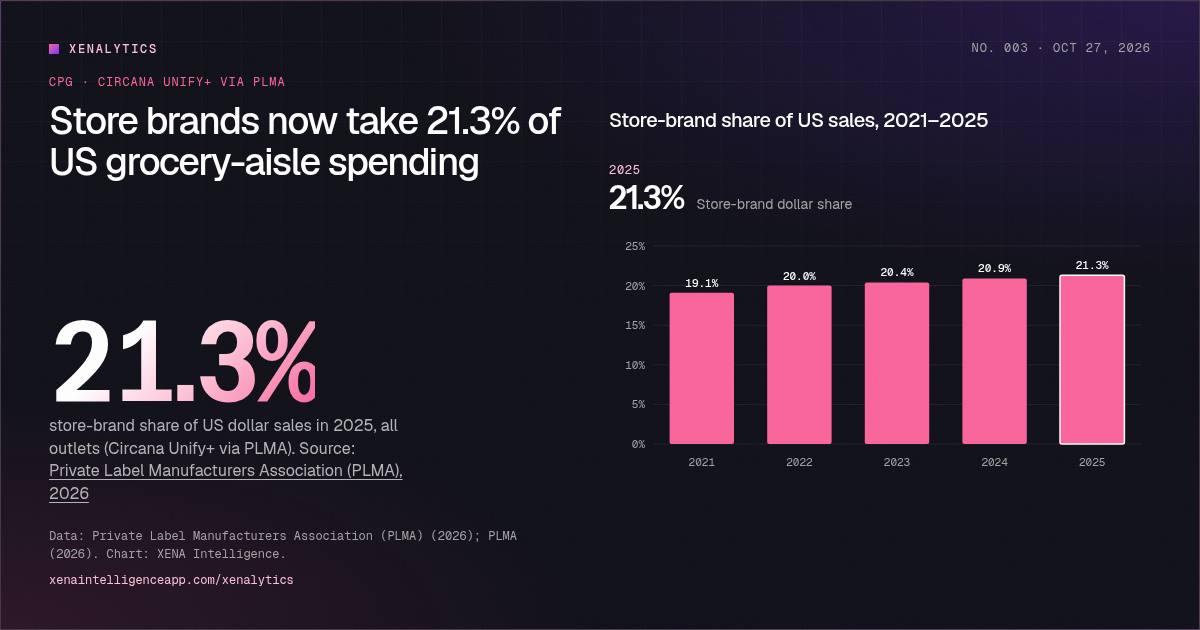
US store brands, also called private label, retailer brands or own brands, had their best year on record in 2025. According to Circana Unify+ data published by the Private Label Manufacturers Association (PLMA), store brands sold $282.8 billion across all US outlets. That is 21.3% of dollar sales in the categories measured, up from 19.1% in 2021.
Measured in units, store brands did even better: 23.5% of items sold carried a retailer's brand. That is roughly one in four products.
The gap between those two numbers is the point. Store brands usually cost less than national brands, so their unit share runs ahead of their dollar share. Toggle the chart above between Dollar share, Unit share and $ sales to see the five-year run: up every year, on every measure.
Growing nearly three times faster
In 2025, store-brand dollar sales grew 3.3%, while national brands grew 1.2%. Total sales across all channels rose 1.5% to $1.33 trillion. In units, the contrast is sharper: store brands sold 0.6% more items, while national brands sold 0.6% fewer, a loss of 1.43 billion units.
PLMA calculates that store brands captured 47% of all dollar sales gains in US retailing in 2025, about $9 billion of the industry's $19.4 billion growth. On PLMA's rounded figures that works out closer to 46%, but the message is the same. Store brands make up about a fifth of the market, yet they took close to half of its growth.
Over five years, store-brand revenue rose by $64.8 billion, or 30%, from 2021 to 2025.
Find your category
Averages hide the real story, which is how differently categories are exposed. Pick your category in the finder below.
Find your category
Pick a category or department. Each square is 1% of its 2025 dollar sales; pink squares went to store brands.
Data table
| Name | Group | Store-brand $ share | Store-brand sales |
|---|---|---|---|
| Adult Incontinence | Nonfood | 32.7% | $0.88B |
| Baking Needs | Food | 39.1% | $2.2B |
| Bottled Water | Food | 31.2% | $8.3B |
| Breakfast Meats | Food | 27.5% | $2.5B |
| Butter/Butter Blends | Food | 48.0% | $2.4B |
| Candles | Nonfood | 57.7% | $1.2B |
| Coffee | Food | 17.6% | $2.4B |
| Cookies | Food | 20.7% | $2.7B |
| Culinary | Nonfood | 33.4% | $1.3B |
| Cups & Plates | Nonfood | 61.1% | $3.7B |
| Dairy Milk | Food | 55.5% | $9.2B |
| Diapers | Nonfood | 14.6% | $0.86B |
| Disposable Tableware | Nonfood | 88.6% | $1.0B |
| Dog Food | Nonfood | 13.3% | $1.4B |
| Dog Treats & Chews | Nonfood | 23.1% | $1.2B |
| Entrees - Rfg | Food | 41.5% | $2.4B |
| First Aid Accessories | Nonfood | 41.1% | $0.97B |
| First Aid Treatment | Nonfood | 37.2% | $0.74B |
| Food & Trash Bags | Nonfood | 46.9% | $2.6B |
| Fresh Bread & Rolls | Food | 25.4% | $4.5B |
| Fresh Eggs | Food | 67.0% | $9.4B |
| Gastrointestinal | Nonfood | 34.6% | $1.8B |
| Home Health Care/Kits | Nonfood | 48.3% | $0.78B |
| Internal Analgesics | Nonfood | 29.6% | $1.4B |
| Kitchen Storage | Nonfood | 44.3% | $2.0B |
| Luncheon Meats | Food | 28.3% | $2.1B |
| Meat - Rfg | Food | 58.1% | $6.4B |
| Natural Cheese | Food | 51.1% | $9.9B |
| Paper Towels | Nonfood | 40.3% | $2.9B |
| Pastry/Doughnuts | Food | 32.0% | $2.5B |
| Poultry - Fz/Rfg | Food | 38.1% | $2.3B |
| Salty Snacks | Food | 7.1% | $2.8B |
| Seafood - Fz | Food | 65.0% | $4.5B |
| Shortening & Oil | Food | 45.3% | $2.8B |
| Snack Nuts/Seeds/Corn Nuts | Food | 38.0% | $2.2B |
| Socks | Nonfood | 34.5% | $0.75B |
| Spices/Extracts/Salt | Food | 28.8% | $1.9B |
| Toilet Tissue | Nonfood | 31.5% | $3.4B |
| Upper Respiratory | Nonfood | 25.5% | $2.8B |
| Vitamins | Nonfood | 20.8% | $2.3B |
| Name | Store-brand $ share | Unit share | Store-brand sales | $ change vs 2024 |
|---|---|---|---|---|
| Refrigerated | 36.6% | 38.4% | $60.8B | +6.1% |
| General Merchandise | 36.0% | 44.4% | $25.0B | +0.9% |
| Frozen | 26.4% | 27.9% | $22.4B | +2.4% |
| Health | 20.6% | 25.2% | $18.1B | −2.3% |
| General Food | 18.2% | 22.9% | $52.9B | +1.6% |
| Pet Care | 17.2% | 18.1% | $5.6B | +3.7% |
| Beverages | 10.0% | 12.3% | $15.1B | +4.8% |
| Household Essentials | 9.9% | 15.1% | $3.3B | −0.4% |
| Beauty | 7.3% | 13.3% | $3.9B | +2.8% |
| Liquor | 0.1% | 0.1% | $0.07B | +3.6% |
Some patterns stand out:
- Commodity staples are store-brand strongholds. 67.0% of fresh-egg dollars and 55.5% of dairy-milk dollars went to store brands in 2025. Frozen seafood was 65.0%, refrigerated meat 58.1% and natural cheese 51.1%.
- Paper and plastics are nearly as exposed. Disposable tableware reached 88.6%, cups and plates 61.1%, and candles 57.7%.
- Brand-loyal categories hold up. Salty snacks were just 7.1% store brand, coffee 17.6% and dog food 13.3%. Taste, habit and emotional attachment still protect national brands here.
- Health is in the middle. Gastrointestinal remedies (34.6%), pain relievers (29.6%) and vitamins (20.8%) show that shoppers will trade down even in categories where trust matters, as long as the product is equivalent.
Departments: where store brands win and lose
Store brands by department, 2025
Sort by dollar share, unit share, store-brand sales or growth.
Data table
| Item | Dollar share | Unit share | SB sales | $ growth |
|---|---|---|---|---|
| Refrigerated | 36.6% | 38.4% | $60.8B | +6.1% |
| General Merchandise | 36.0% | 44.4% | $25.0B | +0.9% |
| Frozen | 26.4% | 27.9% | $22.4B | +2.4% |
| Health | 20.6% | 25.2% | $18.1B | −2.3% |
| General Food | 18.2% | 22.9% | $52.9B | +1.6% |
| Pet Care | 17.2% | 18.1% | $5.6B | +3.7% |
| Beverages | 10.0% | 12.3% | $15.1B | +4.8% |
| Household Essentials | 9.9% | 15.1% | $3.3B | −0.4% |
| Beauty | 7.3% | 13.3% | $3.9B | +2.8% |
| Liquor | 0.1% | 0.1% | $0.1B | +3.6% |
By department, Refrigerated had the highest store-brand dollar share in 2025, at 36.6%, and was also the biggest in dollars, at $60.8 billion. It also grew the fastest, up 6.1%. General Merchandise came close on dollar share (36.0%) and led on unit share (44.4%). At the other end, Beauty was 7.3% store brand by dollars and Beverages 10.0%.
Growth was not universal. Health store-brand sales fell 2.3%, Home Essentials fell 0.4% and Automotive fell 0.5%. Even in a record year, private label has to earn its place category by category.
Which department has the highest store-brand share of dollar sales?
Answer: Refrigerated. Refrigerated: 36.6% of its 2025 dollar sales went to store brands, led by eggs, milk and natural cheese. General Merchandise is close behind at 36.0%, and it is the leader on units (44.4%).
Source: Private Label Manufacturers Association (PLMA), 2026
Why it's happening
Three forces are behind this run, according to the industry voices quoted in PLMA's report.
Price-conscious shoppers. After years of inflation, shoppers have made comparing prices a habit, not an emergency measure. Many now mix premium national brands in some categories with store brands in others.
Better products. Retailers have moved well beyond the generic "value" tier. GlobalData's Neil Saunders, quoted by PLMA, points out that since 2021 the premium store-brand tier has grown faster than the value tier. Retailers now launch on-trend items under their own names.
Retailer strategy. For retailers, store brands mean differentiation, loyalty and usually better margins. Some are setting public targets; PLMA cites Albertsons aiming for a 30% private-label share.
What it means for national brands
For CPG brand owners, the "find your category" tool is a risk map. If your category sits above 40% store-brand share, the retailer is your biggest competitor as well as your customer. It controls the shelf, the price gap, the search results on its website and, increasingly, the retail media placements around your listing.
That shifts where brands have to win:
- Justify the price gap. Content, reviews and claims on every product page must make clear why your product is worth more than the store brand next to it.
- Win discovery before the shelf. More shopping journeys now start in search engines, marketplaces and AI assistants. A brand that isn't recommended there arrives at the shelf as just another option next to a cheaper house brand.
- Measure by category, not in aggregate. A 21.3% national average tells you little. Your exposure depends on your category's share and trend.
A note on the data
All figures are Circana Unify+ all-outlet data published by PLMA in its 2026 Private Label Report, covering the 52 weeks ending December 28, 2025. Other providers, notably NielsenIQ, use different store panels and category definitions, so their store-brand shares differ. Compare trends within a single source, not numbers across sources. The finder includes PLMA's top 20 food and top 20 nonfood categories by store-brand dollar sales, so it is not an exhaustive list of every category.
Methodology and notes
- All figures are Circana Unify+ all-outlet data as published by PLMA for the 52 weeks ending December 28, 2025. Circana is PLMA's data provider.
- Other data providers, such as NielsenIQ, measure different store sets and categories and publish different store-brand shares. Don't mix figures from different panels.
- PLMA says store brands took 47% of 2025 dollar gains, describing it as about $9 billion of $19.4 billion. The rounded figures it gives work out to about 46%; we show PLMA's stated 47%.
- Charts, rankings and calculated figures (growth rates, multiples, gaps) are XENA Intelligence calculations from the sources below. Estimates and forecasts are labelled as such.
Sources
- Private Label Manufacturers Association (PLMA) (2026). PLMA 2026 Private Label Report: A Statistical Guide to Today's Store Brands (Circana Unify+ data, 52 weeks ending Dec 28, 2025)
- PLMA (2026). US private label industry reached $282.8 billion in sales in 2025
Cite this infographic
Free to cite and share with a link back to this page.
Embed this infographic
Paste this code into your site or newsletter. The embed is interactive and links back to the full analysis.